Bitcoin Slides to Multi-Month Lows Amid ETF Exodus
Oversold RSI hints at relief rally, but trend remains bearish
The selloff in cryptocurrencies worsened this week, with Bitcoin falling below the critical support at $65K and reaching a low of $61,300. The crash is happening as institutional investors are dumping spot Bitcoin ETFs and geopolitical risks are rising.
Capital is moving out of cryptocurrencies and into stocks, mostly A.I. companies, which have been constantly printing record highs. Bitcoin’s underperformance has persuaded investors to cut their losses and move into equities, which in turn triggered more downside movement for the crypto market.
According to data from Coinglass, Bitcoin ETFs have seen combined outflows of over $3 billion since May 20. During this time, there wasn’t a single day of inflows, which shows the general sentiment is deteriorating.
The US – Iran conflict has been a constant headwind for cryptocurrencies and an important part of the latest selloff. The two countries have been working towards an agreement to extend their current truce by two months. However, earlier in the week, the US military struck an empty oil tanker headed for Iran, and the latter attacked US bases in Kuwait and Bahrain. This new clash is likely to make a peace deal that much harder.
If the Middle East conflict drags on, this will further affect the energy prices, which in turn will lead to elevated inflation levels in the US. The chances of a rate cut by the Fed are already close to zero, but growing prices could lead to a rate hike later in the year. The Non-Farm Payrolls (NFP) report will be released later today, and this could change the interest rate odds. A higher rate would further hurt risk-on assets, such as Bitcoin.
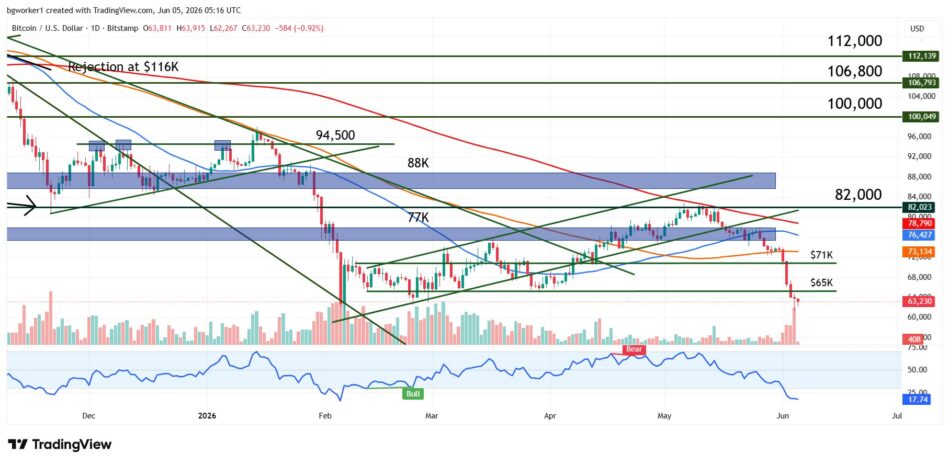
Chart Analysis – BTC/USD
After Bitcoin exited the ascending channel, the chances of a slide increased, and that slide materialized this week. All the daily candles have been big and red, showing very strong bearish momentum and buyer capitulation, especially after breaking through the 100-day Moving Average.
The selloff accelerated after the break of $71K support, and now the first potential target sits at $60K. If that barrier is broken, we may see a move into the $55K – $52K zone, which was a bottom in 2024.
The Relative Strength Index (RSI) is deep in oversold territory, currently showing a reading of 17 (below 30 is considered oversold). This may trigger a relief rally, but unless the price can stabilize above $65K, the bullish move may be short-lived. Bitcoin could create a double bottom (together with the low reached in February 2026), which is a bullish pattern often seen at the end of a downtrend.
Bitcoin falls below the critical $65K support zone as ETF outflows accelerate, with traders watching $60K as the next major support and RSI signaling extreme oversold conditions.