The Usefulness of High-Compression Fibonacci Levels
May 30, 2013
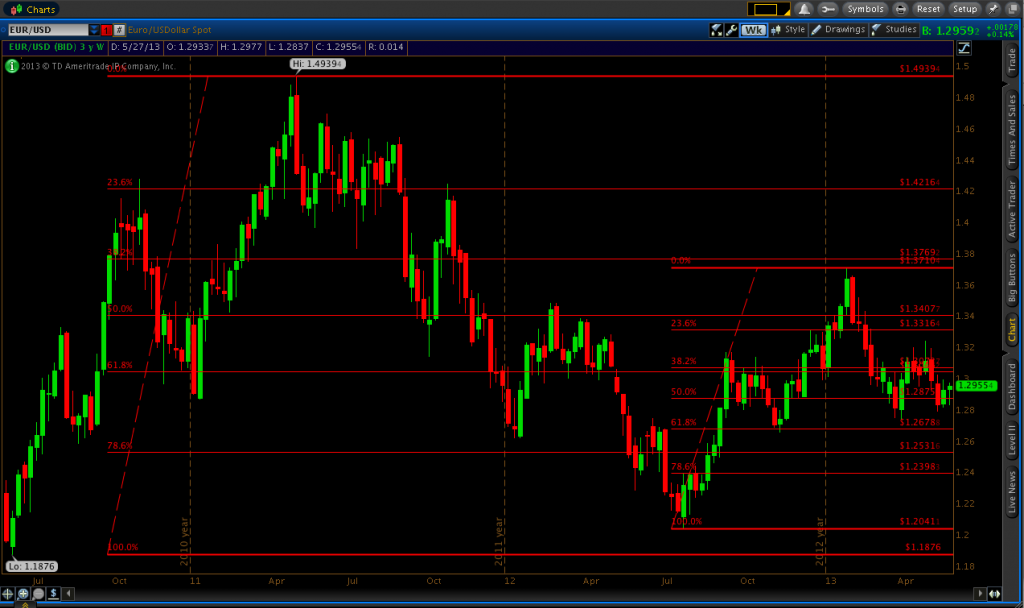
Fibonacci levels are something that I pay special attention to in trading both forex and binary options. Essentially all charting software packages allow you to manually plot Fibonacci levels on a chart, usually by drawing them from the low point to the high point of a recent trend in the given asset. I usually will only plot them on Daily and Weekly timeframes, as those tend to provide the most robust levels. But I have heard of some traders successfully using them on the lower timeframes for scalping forex and binary options trading. I’ve included a screenshot below of the current Fibonacci levels I have plotted on my EUR/USD chart. Both were drawn from the weekly timeframe.
In today’s binary options trade, I took a put option along a very strong resistance level coupled with the 50% retracement level. It turned out to be one of the best binary trades I’ve ever taken. The 50% level was located at 1.28757 and had been touched yesterday around noon EST and touched again later that afternoon. By the time I took the trade at 3:25AM EST the EUR/USD had been in an uptrend over the past couple hours, but based on previous resistance and the general respect the market tends to have toward 50% Fib retracement levels, 1.28757 was probably going to present a strong trading opportunity.
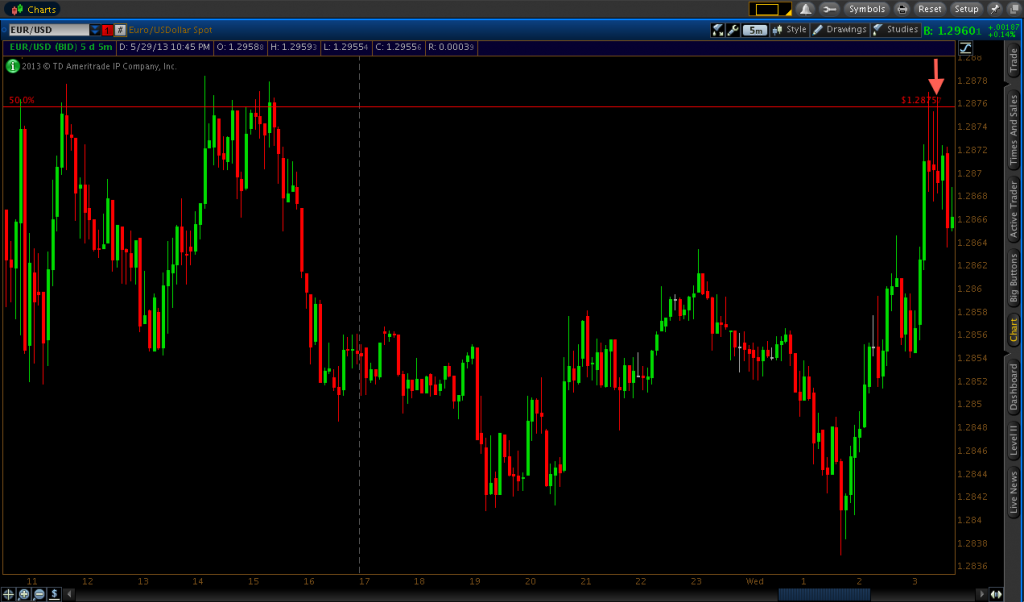
That said, I didn’t immediately hop on the put option button as soon as 1.28757 was touched. Price had gone up about 20 pips within the past fifteen minutes by that point, which was an obvious indication that northward momentum was strong and a potential breach could be in store if there was enough buyers in the market. But sure enough, price reached about a pip above the 50% retracement on the 3:15 candle before sharply heading back down. This told me that the euro simply didn’t have enough juice at the moment to breach the level outright and head to new highs. Another visit to 1.28757 would likely lead to another rejection. About ten minutes after the initial touch, price came back up to 1.28757 before I finally took my put option on the 3:25 candle. It was a bit of a longer trade – I was in it for around 17 minutes – but it turned out to be over a ten-pip winner. By the 3:50 candle, price had retreated from the 50% retracement level by over 20 pips.
If you don’t already use Fibonacci levels in your trading at least as a tool to supplement your trading and find potential turning points in the market, I would strongly recommend doing so. The strategy I use for any type of trading fundamentally revolves around price levels that I feel might be robust enough to hold. There is no fundamental reason why price tends to gravitate toward Fibonacci levels – they simply tend to work because enough traders use them on their charts to drive price to those areas.
And once again, I can’t help but stress the importance of being patient and finding only the best set-ups to trade. When I first started trading binary options nearly two years ago, I was more of a higher volume trader, thinking that trading more will allow me to make more money. Of course, it turned out to be quite the opposite. Now today, I’m quite strict about the set-ups I take and my accuracy is as high as ever (close to a 75% win rate). In today’s trade, I was eyeing a certain level the entire time, yet when it came to it I didn’t automatically trade it, preferring to wait and confirm that I had a strong level of resistance. If price had never gone back up to 1.28757 and I missed the trade entirely I wouldn’t have had the slightest regret. It’s all about patience and knowing that if you have some sort of trading strategy that gives you a statistical edge on the market and you consistently apply it over and over and over again, you have a good chance of being a successful trader.