AUD/JPY Trading on August 15, 2013: 3/4 ITM
I received the motivation to do some AUD/JPY trading due to bo_brown’s trading thread on the forum. This isn’t a pair I’m readily familiar with, as I don’t really recall ever trading it at any point. But the five-minute screenshots he posted of the pair looked really good in terms of the pair’s sensitivity to support and resistance levels and relative lack of volatility spikes, creating relatively smooth price action. So I decided to give it a shot. In order to do so, I decided to return to one of my former brokers (Markets Worlds). I’m not the biggest fan of their variable payout structure (saw as good as 95% and as bad as 65% of the assets I had up on my screen), but still the payouts weren’t too bad overall. But as long as I’m able to average about 80%, I’ll be happy, which is actually pretty good nowadays in the industry.
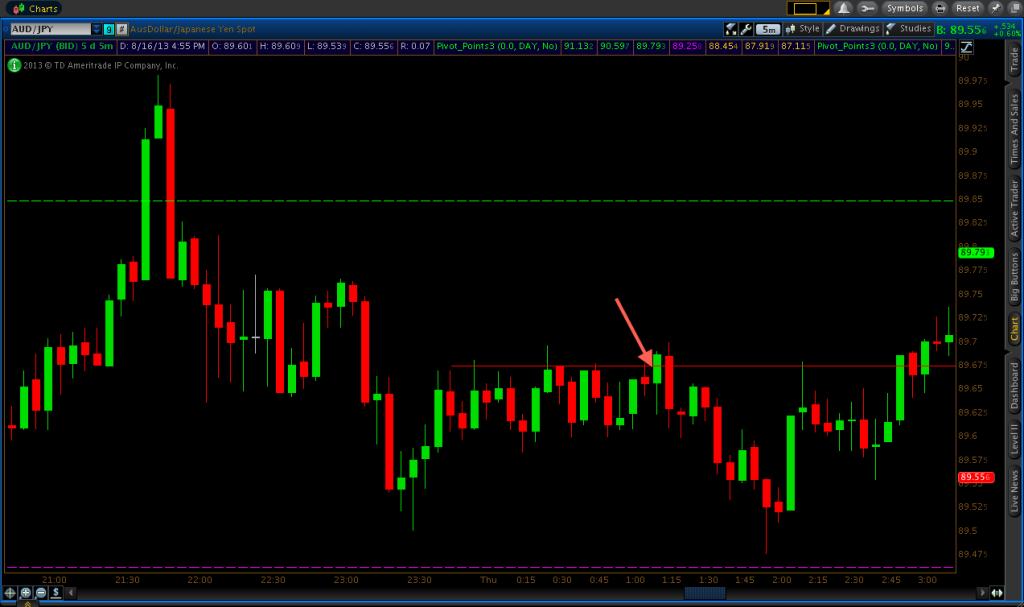
The first two levels I had available to me were two daily pivots points – resistance 1 at 89.849 (green line) and the pivot level of 89.461 (purple line). But the first trade I took came between these points at 89.674 where price had been consolidating as an upper-range resistance level for about ninety minutes. The AUD/JPY was also in somewhat of a downtrend at this point, which also held true on the more macroscopic time compressions (four-hour and above). Price rejected 89.674 on the 1:05 candle, so I took a put option on the 1:10 candle. At Markets World, I take the ten-minute expiry trades. Therefore, all trades I take expire on the close of the next five-minute candle. This trade won by nearly five pips.
After this trade, I did have a support level open at 89.543, but I decided to bypass this opportunity due to the ongoing downtrend and the fact that I was quite confident that the market would come down to the daily pivot level. This didn’t happen, as it stopped about a pip-and-a-half shy, but I was definitely targeting this area for potential call option set-ups.
At this point, the market reversed course and began rising. There were certain bouts of consolidation and during this new uptrend, but nothing was screaming at me to trade and as long as the pair was making higher highs and higher lows (definition of an uptrend), I decided to ignore any call option set-ups. I felt that it was going to eventually going to reach the resistance 1 level of 89.849 anyway.
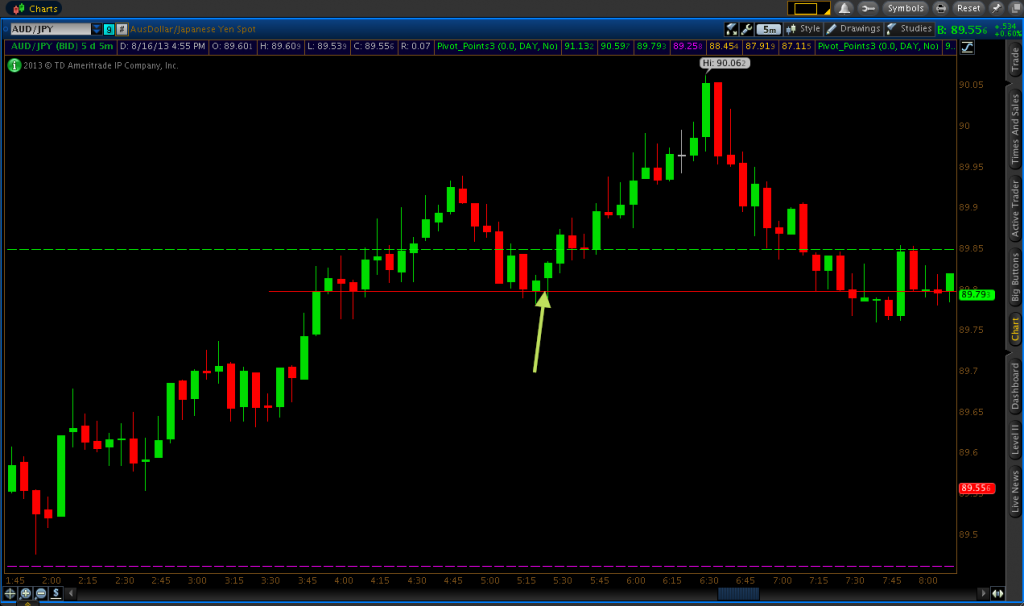
The pair finally hit 89.849 on the 4:10 candle, and rejected it. I took a put option on the re-touch on the 4:15 candlestick and had a two-pip winner by expiration. The closing (4:20) candle did form a bearish engulfing pattern of the previous candle, but the candle on which I took the trade saw a false break to the north-side, so I did not take any further put options. I’m not opposed to taking consecutive trades at a price level if the situation according to my judgment favors such a decision, but false breaks are usually a key sign that a breach of a certain support or resistance level could be forthcoming. There was a more significant false break on the 4:25 candle before the market breached resistance 1 for good to make new daily highs.

My next trade was a call option set-up just back below resistance 1 at 89.798. I was confident in this trade due to the uptrend that had been running for the past few hours. And in my experience, when price breaches a pivot point and then proceeds to go back through it soon after, it’s usually an indication that price wants to maintain a holding pattern around that level until something motivates it to do otherwise. In this case, I didn’t think a visit back down to the pivot level would be likely being it was still very early (after 5AM EST), nor did I think a rise up to resistance 2 would be likely either.
So I felt a call option set-up at 89.798 could work out due to the support level that had formed around that area just before the market first reached up to resistance 1 for the day. I took the trade on the 5:25 candlestick just as it was apparent that 89.798 was beginning to hold again. I was able to get a bigger than expected winner on this one – about seven pips as the market saw another break of resistance 1 to the north-side.
My final trade occurred at the 89.926 resistance level on the 5:55 candle. This was currently the resistance level created by that day’s high. A doji had formed on the 5:50 after a rejection of 89.926. Of course, following how I normally trade from the five-minute chart, I took the re-touch of 89.926 on the subsequent candle. I did see another nice bounce here, but the down move wouldn’t sustain and I lost this trade by about a pip.
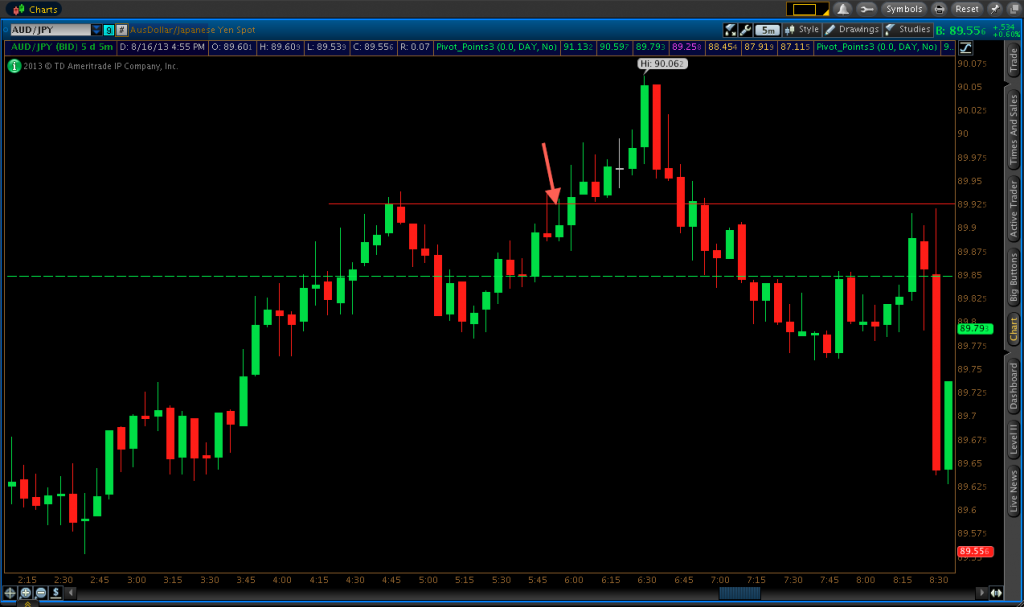
I stopped trading for the morning soon after this. I was waiting for a potential call option set-up at 89.926, but price went right through on the 6:45 candle so that set-up never materialized to my liking.
And to reiterate, I was using Markets World as my broker for these trades. I quit using them in the past because I was consistently obtaining poor fills (i.e., getting in at the market price you want). This was causing me to lose trades that would have otherwise won. But today, the fills and payouts were fair, so I’ll keep Markets World as a back-up when I want to shake up my binary trading routine.