Zig-Zag Indicator – Useful for Filtering Out Market Noise
Use the Zig-Zag to filter out market noise, and get a clearer view of market direction. The Zig-Zag isn’t really an indicator, as it isn’t going to give you trade signals. Rather, it simply makes your analysis easier. It can quickly show noteworthy corrections, as well as make Elliott Wave counting and finding Fibonacci Retracement and Extension points easier.
The Zig-Zag
The easiest way to see how the Zig-Zag works is to apply it to a chart.
Figure 1. S&P 500 ETF with Zig-Zag (4%)
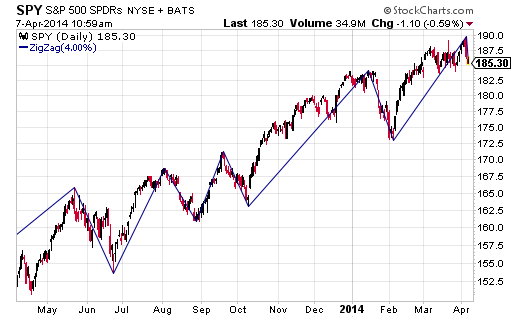
The Zig-Zag takes all the noise of the market and provides straight lines to connect high points and low points.
It does this by filtering out all price moves less than 4%, in this example. The % filter can be adjusted to any percent desired.
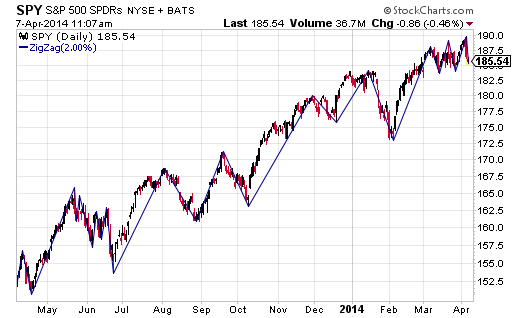
A 1% or 2% filter will draw more lines, since less information is being filtered out. This makes the Zig-Zag choppier, as shown in Figure 2.
Figure 2. S&P 500 ETF with Zig-Zag (2%)
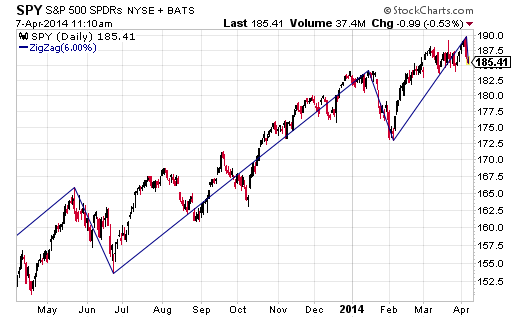
If we increase the % filter then there will be fewer lines drawn, as the Zig-Zag will ignore all minor price moves and only connect significant highs with significant lows (significant for the time frame).
Figure 3. S&P 500 ETF with Zig-Zag (6%)
While daily charts are used for the examples above, the Zig-Zag can be applied to any time frame. In addition to the % filter, some variations of the Zig-Zag also include an Average True Range (ATR) filter.
Aiding Elliott Wave Counts
Anyone who has used Elliott Wave knows that when you are starting out, getting rid of some of the noise can help. The Zig-Zag shows only the strong moves, and thus highlights impulse waves and corrections.
Unfortunately, you’ll still need to count the waves, and also realize when the Zig-Zag may have skipped over an important retracement (filter may need adjustment).
Elliott Wave analysis is beyond the scope of this article. For more on Elliott Wave, see Introduction to the Elliott Wave 5-3 Pattern.
Fibonacci Retracements and Extensions
A variation of the Zig-Zag, called the Zig-Zag Retrace, shows retracement and extension levels, relative to prior waves. This is similar to the Fibonacci Retracement and Extension indicators.
Common Fibonacci Retracements levels are: 23.6%, 38.2%, 50.0%, 61.8% and 78.6%.
Common Fibonacci Extension levels are: 61.8%, 100%, 138.2%, 161.8%, 200%, 238.2% and 261.8%.
Therefore, you can watch for these numbers to show up on the Zig-Zag Retrace.
Figure 4. S&P 500 ETF with Zig-Zag Retrace (4%)
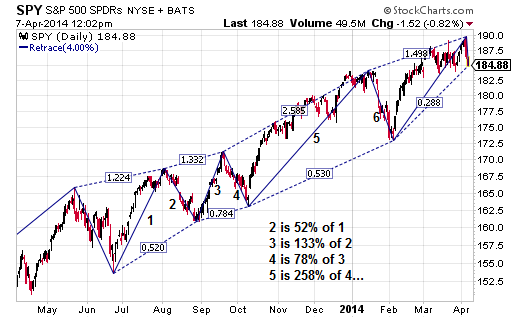
Some of the waves have been labeled, so you can see how to read the numbers provided by the Zig-Zag Retrace.
Notice how if you would have been watching for Fibonacci levels, a number of these extensions and retracements reversed near the Fibonacci percentages listed above. Fibonacci numbers provide areas to watch, not exact entry signals. Therefore, this indicator would have be useful for automatically showing how far the market had extended or retraced, so you could then make your trading decisions and act on your signals.
The Final Word
The Zig-Zag and the Zig-Zag Retrace are not indicators typically used for providing trade signals. Rather they are analysis tools which filter out market noise, can be used on all time frames, aid in Elliott Wave Counting and can provide retracement and extension levels. The retracement and extension levels are useful when combined with traditional Fibonacci levels.