Using Ranges For Trading Shorter Time Frames
Forex pairs are often the perfect assets for trading shorter time frames. This is because they tend to trade in ranges as the competing central banks jockey back and forth for dominance over the global economy. These ranges tend to last for extended periods and can be quite narrow, especially when compared to other assets like stocks or indices. This is why they are perfect for trading the shorter time frames such as 5 minute and one hour binary options. Indices and stocks form ranges on monthly, weekly and daily charts; forex pairs for them on daily and hourly charts. If a long term range can be used to pinpoint long term signals then it makes sense that a short term range can be used for pinpointing shorter term signals.
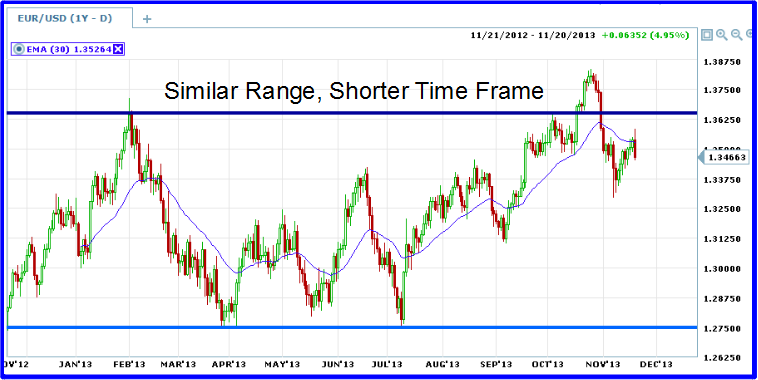
The other day I was looking at some charts, flipping back and forth between assets and time frames. While flipping between the EUR/USD and the SPX something struck me which is what led to this posting. The short term ranges of the currency markets resembles the longer term and secular ranges presented by other asset classes. Take a look at these two charts. The first is a ten year chart of monthly candlesticks for the S&P 500, the second a one year chart of the EUR/USD currency pair.
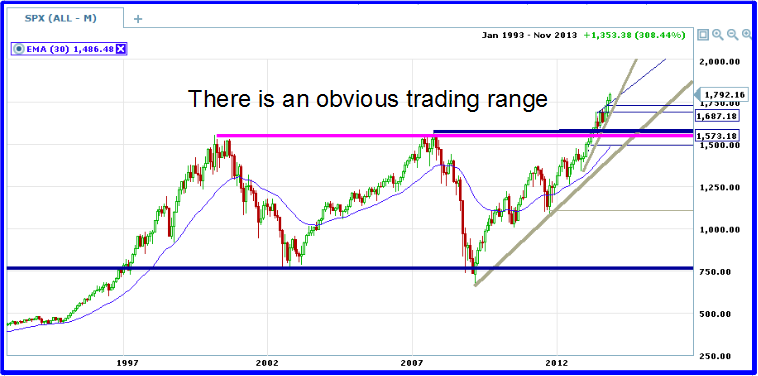
The long term secular range shown on the SPX chart is comparable to the EUR/USD daily chart in that both are in obvious trading ranges. I’ll use that fact as our frame of reference. Someone trading the SPX may use this chart as the basis for a trade decision, targeting a reversal or perhaps a trend following signal. He (or she) may look at this chart and see what the long term trend is in relation to said support and resistance. The trader may then move down to a lower time frame to check on the shorter term trends. Really savvy traders may then move down even further to charts of one day candle sticks in order to pin point entries for shorter term binary trading, all the while capitalizing on the long term range. Possible trading strategies include trend following techniques that follow the path of the SPX as it moves from one extreme to the other. Other possibilities include capturing reversals at the extremes. The point here is the SPX is trading in a range and that range can be exploited for profitable entries in lower time frames. In the case of the SPX it means signals on daily and hourly charts with weekly and monthly expiry. However, if the identified range were in a shorter time frame then the signals would likewise come in shorter time frames.
Now let’s move over to the chart of the EUR/USD and a shorter time frame. If we can assume that a strategy will work for the SPX while it is in it’s range then we can also assume a similar strategy will work on the EUR/USD while it is within a range. The important thing to note for this comparison is that the asset be trading in a range in relation to the chart at hand. On the SPX we moved down 3 (three) time frames in order to place a trade, from monthly to weekly to daily to hourly. If we were to do the same thing with the EUR/USD that would mean taking a trade on a chart of 1 or 2 minute candles; a move down from daily to hourly to 15M to 2M.
Once the longer term range is identified it is time to narrow the focus and look for a signal. Moving down three time frames to a 2 minute chart is more extreme than I like to trade so I will only go down 2X. Market movement, even on a heavily traded pair like the EUR/USD, is highly unpredictable on one and two minute charts. In the chart above we can see that the pair is near the top of the range and moving lower. The false break out and current black candle just below the moving average are very bearish. In the chart below of 15 minute candles we can see the asset moving down strongly from the 30 EMA confirming the bearish stance taken on the previous chart. The important thing to note here is that we are now watching for a signal on a chart of 15 minute bars, versus one day bars above.
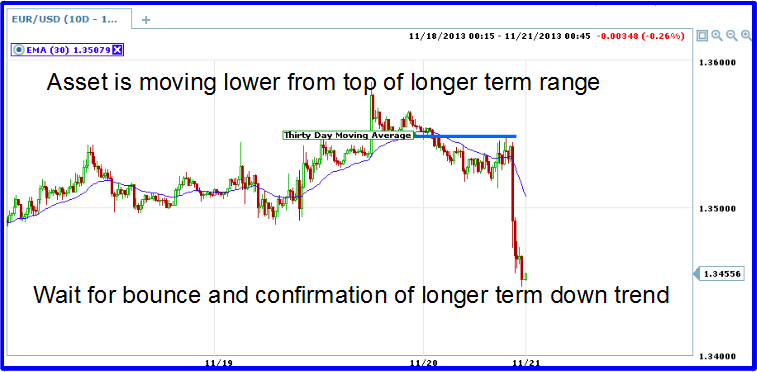
So long as the asset is within the trading range we can expect it to behave like a range bound asset. For binary traders this means taking signals on bounces from support, falls from resistance or following the trend when that is appropriate. In this example the longer term trend is range bound and down so we will be looking for a bearish trade in the shorter time frame. The 15 minute chart shows an extended market so at this time it would be advisable to wait for a bounce higher and another trend following signal. Based on the longer term chart we can assume that the EUR/USD will move lower until it reaches a strong support or the bottom of the range, whichever comes first. Until that support is reached trend following signals can taken keeping in mind to tailor expiry to the time frame being traded.