Trade in Channels, avoid Breakouts!
Hi Traders,
in this article I am going to talk about how to draw simple channels and take solid trades inside them and how to avoid the breakouts.I will explain this with EUR/JPY currency pair and with some trades I took in 4/4 in this pair. Take a look
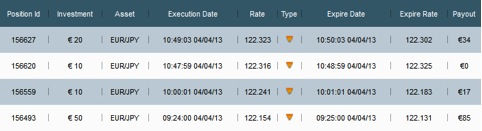
I took 4 trades in EUR/JPY, 3/4 ITM. The one OTM was a wrong entry because I made an early entry and I didn’t wait the right time. Entries of your trades are the most important thing.You can loose your money because of a false or an early entry, even your strategy is good. Now, let’s go to see the first screenshot.
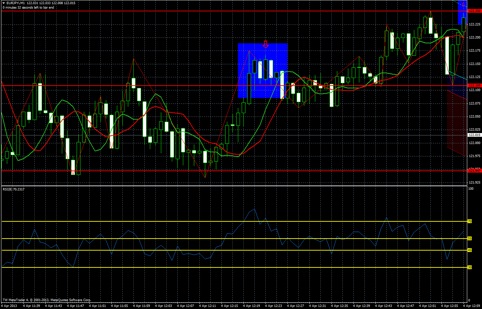
In the beginning of the screenshot we have our first resistance level(the red horizontal line).After that, the price is moving down and makes a support in the red horizontal line down.Your channel is ready.You can take your trades inside the channel, when the price hit again the resistance or the support.You can have at least 2 ITM trades.RSI or a Value Chart indicator could be your confirmation.Now, look at the blue box. We have a small breakout here.It’s the third time that the price is trying to break our resistance.Many newbies may think “Look look the price hit the resistance.I will take a put!”Their puts will be OTM.The reason is the breakout. You can see that there is a long green candle which doesn’t stop in the resistance and there isn’t a rejection this time. The price makes new higher highs and this condition is unpredictable. It may be a great chance for short-term stock traders to make good money because stocks have often the influence of the news but I don’t recommend it for Binary Options traders, at least for the short-term traders like me. I took my trade in the put arrow. Finally, the breakout was small and the price made a new resistance. The second time the price hit this resistance I took a put. I was sure because the breakout was weak and my stake was 50 Euro. ITM.
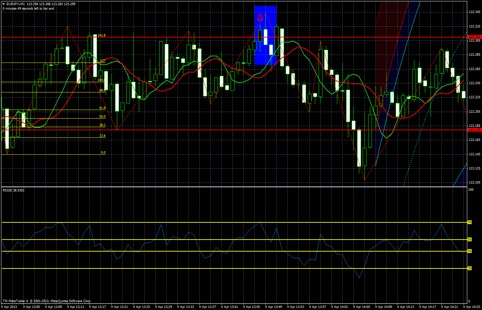
In the second screenshot you can see that we have again a channel.Some minutes later from the first screenshot the price is moving up in a strong uptrend(notice the EMA’s) and finally makes a resistance in the red horizontal line which is 161.8 fibonacci extension level.This resistance it’s strong and has a big duration.Inside the channel you can see that we have new supports and each time after them the price is trying to break the resistance but it can’t. I took my trade in the blue box. RSI overbought was my confirmation.ITM.
If you can draw a channel with a strong resistance and a strong support you have a safe way to take your trades inside the channel, but you should always identify the breakouts and just don’t trade against them.
Kind Regards,
Kostasze