Prominent Stock Market Cycles
The cycles discussed here are longer-term cycles, and not pressingly relevant to short-term traders. Yet, by seeing these cycles and understanding how cycles work, you may be able to find your own cycles and cycle strategies for trading on shorter time frames. And if nothing else, knowing about these cycles can make you sound very smart sitting around the dinner table.
Stock Market Cycles
A cycle is an event or series of events that repeat over time. Circumstances may vary from cycle to cycle, but overall the general events or series of events which compose the cycle are present. A simple example of a cycle is “the rainy season,” present in some form in most parts of the world. It comes once a year, roughly starting and ending around the same date. The exact dates will vary from year to year, but the event is highly likely to occur within a fairly specific time frame each year. The severity of each rainy season may also change, potentially due to even larger weather cycles we are not aware of. For example, we know when the rainy is likely to begin, but we don’t know the severity or mildness of it.
So the cycle is a recurring event(s) that occurs at repeating time intervals. Cycles are found throughout nature, biology, financial markets and all time frames, from seconds to thousands of years.
As you can imagine, there are potentially hundreds of stock market cycles, found by various traders and researchers. If this topic interests you, there are many books available on the subject. Here we’ll go through some of the most well known market cycles.
The longer the cycle, generally the greater the magnitude of the stock market bottoms and tops it will forecast. When multiple cycles align to form a bottom or top, such as the 54 year, 18 year and 9 year cycles all indicating a bottom around the same date, this adds weight to the expectation of a major forthcoming bottom in prices.
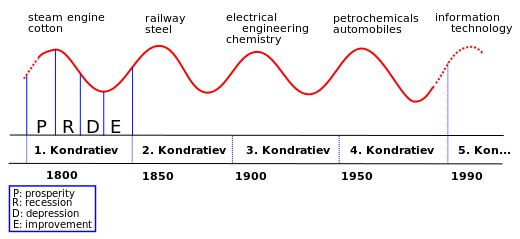
Kondratiev Wave
This is a large scale cycle or wave generally lasting 46 to 60 years, with the average being 54 years. It also makes you sound sophisticated at the dinner table. This is mostly an economic indicator, showing long-term expansion and contraction in the global economy. It has also helped mark peaks in different eras, such as the advent of railways, automobiles, chemistry and modern technology. Stock markets typically precede major economic moves, as the stock market is a leading indicator of the economy. Therefore, this cycle is still relevant to the stock market.
Kuznets Cycle
This is a shorter cycle, lasting between 15 and 25 years with the average being 18.3 years. The premise for the cycle was originally founded on economic data. It found in 1930 by Simon Kuznets. To apply the cycle, you’d look for major stock market bottoms about 18 years apart. From prior stock market bottoms you can then project when another market bottom may occur based on the cycle.
Juglar Cycle
The Juglar cycle lasts between 7 and 11 years and was discovered in 1862 by Clement Juglar. This was later refined down to a 9.2 year cycle by Edward Dewey. From prior stock market bottoms you can then project when another market bottom may occur based on the cycle.
Kitchin Cycle.
This cycle lasts roughly 40 months, and it is used by many longer-term traders to watch for bottoms and tops within the longer-term trends. In was discovered in the 1920s by Joseph Kitchin.
Juglar and Kitchin Cycles with Dow
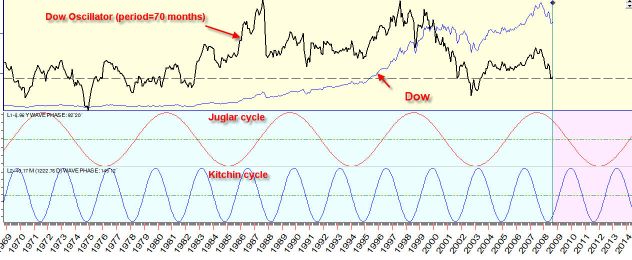
Source: timingsolution.com
Other Cycles and Considerations
Traders have found 1.5 year cycles, yearly cycles, half year cycles and quarter year cycles…right down to 2.8 day cycles.
While certain cycles are likely to be relevant, and may in fact aid with trading decisions, other cycles may just be statistical noise which has been “fitted” to historical data. In such cases, the cycles are present on historical data, but may not continue to work in the future.
We also find that many stock market cycles work most of the time, but not all time. This may because even larger and more powerful cycles are at work. For example, a pullback around the 9 year point may be extremely small or non-existent if we are in a major bull market based on longer-term cycles.
Cycles are a way to help improve timing for trades. Whether day trading or investing, cycles give you a time window to watch for changes in direction. Use other methods of analysis as well, as most cycles are not precise enough to be used in isolation.