Parabolic SAR Indicator and Strategy
The Parabolic SAR is an indicator and trading system developed by Welles Wilder, which can be applied to price charts. What follows is the basic strategy; you may wish to add additional indicators or forms of analysis to filter out some trades, as this strategy keeps you in the market at all times, which may not be ideal.
Parabolic SAR
SAR stands for “stop and reverse” which means when signals appear the trader gets out of the former position and initiates a new one in the opposite direction.
While the calculation for the SAR indicator is rather complex, basically it attempts to isolate trends. When the trend is down the indicator “dots” are above the price bars. When the trend is up the indicator dots are below the price bars.
These dots act as a trailing stop on the position. For example, if the trend is up, when the price drops below the dots exit the long trade. A short trade can also be initiated. The new short/put is held until the price moves back above the dots.
Figure 1 shows how the Parabolic SAR looks and works.
Figure 1. EURUSD with Parabolic SAR – 5 Minute
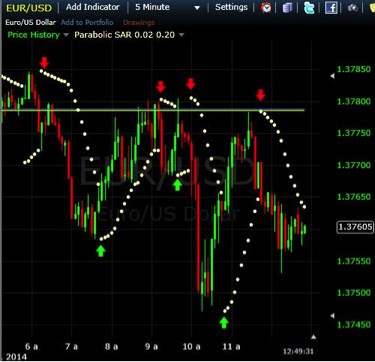
The indicator and trade signals work best when there is a strong trend. In a sideways or choppy market the signals may not produce quality signals.
There are some variables that can be altered on the indicator. “Step” and “Maximum Step” are the variables and determine how sensitive the indicator is to changes in direction.
Decrease these variables to make the indicator more sensitive. This would likely be good for short-term and very active traders. Increase the variables to make the indicator less sensitive. This would likely favor longer-term traders who don’t mind holding through pullbacks and want to utilize a less active strategy.
Adjust these settings to determine a good fit for the instruments you trade and time frame you trade on.
Potential Filters
One way to filter out some trades is to only take signals in the in the dominant direction of the trend–but not take the trade signals that occur against that trend.
Figure 2 shows a long-term uptrend in the S&P 500. Therefore, when the parabolic SAR provides a signal to buy, buy. Close the position when it signals to sell, but don’t go short/buy puts.
Figure 2. S&P 500 with Parabolic SAR – Daily Chart
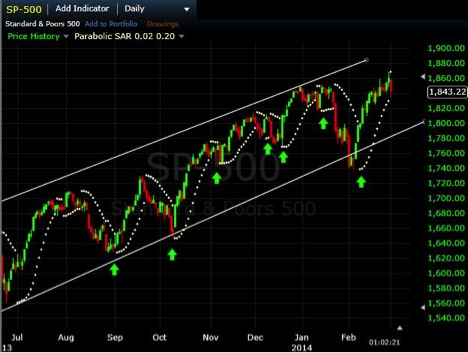
The green arrows indicate buy signals. The trade is closed when the dots move on top of the price bars. There are no red arrows because no short/put trades are taken, as the dominant trend is up.
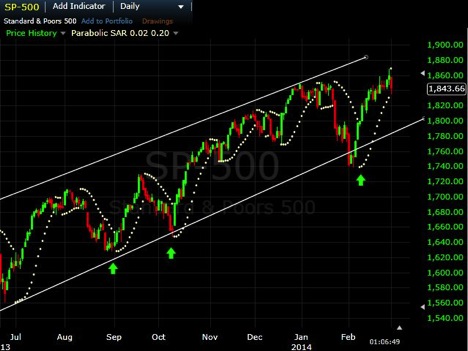
In the case above we can also see that price is moving within a trend channel as well. To further filter signals a trader could take only those trades that occur near a channel bottom (in the case of an uptrend, or a channel top in the case of a downtrend) or trendline.
Figure 3 shows that this cuts down the number of trades, and in this case avoided some of the lower quality signals which occurred toward the top of the channel during choppy price action.
Figure 3. Trendline Filter
Final Word
The Parabolic SAR is an indicator that acts as a trading strategy. Ultimately though you will need to define your risk on each trade, and determine which signals to take and which to avoid. Looking at multiple times frames can aid in this, as trading with a trend generally provides higher quality signals than when the market is choppy. It is up to the trader to determine when the indicator and strategy is likely to be profitable, and when it is likely to produce poor signals due to market conditions. It is highly recommended other forms of analysis, especially price analysis, are used in conjunction with SAR signals.