Only Looking At One Time Frame? You’re Likely Missing Something
When day trading, looking at both the long and short-term technical outlook of an asset can be a big advantage. If you only look at a 1-minute chart for example, you may be missing the larger trend. And if you only look at a daily, hourly or 15 minute chart you’re likely missing a lot of intra-day opportunities and getting into, and out of, trades too late. Each that day I trade I go through a series of charts, marking them up and making notes of where I should be watching for potential reversals, profit targets, breakouts, support and resistance levels. Here’s how I do it.
Go From Long-Term to Short-Term
If day trading, I will look to a daily chart first, followed by an hourly and then the timeframe I use for trading–either 1 or 5 minutes. If you are a scalper–trades last seconds or a couples minutes maximum–the daily chart may not matter, but I would still check out an hourly or 15 minute chart in addition to regular timeframe chart.
If swing trading I may get the overall lay of the land using a weekly or even a monthly chart, and then from there drop down to a daily chart and then to my trading time frame which is usually a 1 hour or 4 hour chart (depending on the market).
Ultimately, the exact time frames you uses don’t particularly matter. What does matter is that you get a full picture of the current technical landscape on the both immediate and longer-term chart.
At times looking at all these time frames may seem like a waste, since they all “tell” you the same thing, or each time frame seems to be telling you something different. But that is valuable information. If all the time frames are pointing to a long trade, there is a likely a high probability trade setting up, assuming you trade in the direction of the trend. Likewise, if all the timeframes conflict with each other, it probably isn’t the best to be trading in that particular market.
Long-Term
Figure 1 shows a daily chart of the USD/CAD. I have added several lines to this chart, representing areas of potential areas of interest over the coming days. The lines you draw may be similar or different, as they will depend on what analysis and trading methods you use.
The main take away is the dominant trend. The trend is up, as represented up the upward slanting green lines showing the progressively higher swing lows in price, and the long upward sloping red lines which show the possessively higher swing highs in price.
The small yellow lines and rectangle mark areas of potential support and resistance, in addition to the longer-term lines in red and green.
Figure 1 – USD/CAD Daily Chart
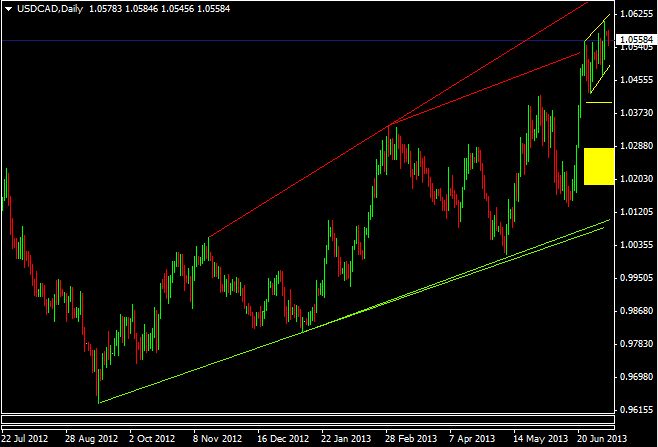
During the next several sessions, or possibly more, I will monitor this chart to see if the outlook changes. Overall though, I am looking for mainly buying opportunities, since I want to trade with the trend.
Since the pair is trading near a couple resistance levels (red lines) if it drops below the either of the small yellow lines, I will hold off on buying since it could decline all the way to the yellow rectangle, or even the green lines. Since I’m primarily day trading, I may even look at taking some short position (puts). But if the price is still falling and it reaches the yellow rectangle and/or green lines I will exit any short positions and then watch to see how the market reacts and if there are any buying opportunities based on the long-term uptrend.
Basically this chart provides a theoretical frame work to work from on the shorter term charts.
Please note that your markings on the chart are not intended to be predictions on what they market will do. As more price data becomes available the outlook may need to revised based on new information. You’ re not trading or predicting off this charts, all you’re doing is developing a basic concept of when the best times to be long (buying calls) or short (buy puts) is given the price action that is unfolding.
Shorter-Term
Dropping down to the hourly chart in this particular instance confirms the longer-term chart. Figure 2 shows the price moving within a channel (yellow bands), so for day or swing trades I’m looking to buy near the lower band and sell near the upper band. If the price moves above the upper band, given the longer-term uptrend I will likely continue to go long. On the other hand, even though the long-term trend is up, if the price drops below the channel the next likely areas for a reversal are at the horizontal yellow line or yellow rectangle. Therefore, if the price drops below the channel I am at minimum holding off on buying, and likely taking short positions when opportunities present themselves.
Figure 2. USD/CAD – Hourly Chart
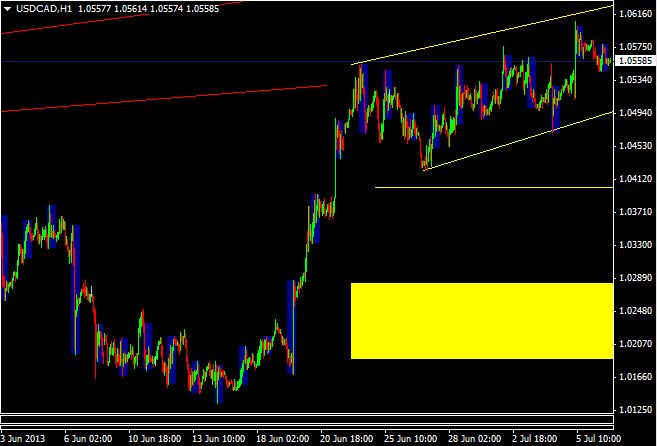
From Figure 2 we can see the price is in the middle of the channel, so the price isn’t too close to any major breakout or potential reversal points. This means I can go long or short based what signals my strategies produce, but more than likely most of those trades will be long (calls) given the uptrend.
Dropping down to the 5 minute chart, none of the significant lines from the previous charts are visible.
Figure 3. USD/CAD – 5 Minute Chart
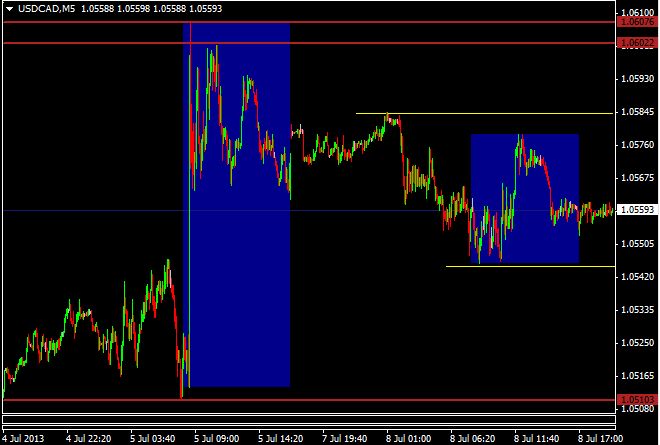
Several simple support and resistance lines have been drawn on the 5 minute chart. The red lines mark significant highs and lows over the past few days, and the yellow lines mark short-term highs and lows. If the yellow lines are penetrated then the price will likely proceed to the corresponding red line. Therefore, when the price remains inside the yellow lines there likely aren’t many high probability opportunities, except for potentially buying near the lower yellow line, and/or shorting near the upper yellow band.
If the price moves above the upper yellow band, this indicates further potential upside toward the upper red lines. Resistance is potentially present near those upper red bands on both short and long-term charts, so I’d hold off trading and watch. If the price drops off that level (upper red lines), it’s a shorting opportunity, if it breaks higher then I’d go long.
If the price drops below the lower yellow line, then I’d be more inclined to short as the price could fall to the lower red line. At the lower red line I’d once again sit back to watch, to see whether that line holds or breaks.
The Final Word
Hopefully this helps you understand the process you should be going through each day to help plan out your trades. Each day the marks on your chart may need to be adjusted based on recent price data. The charts aren’t meant to predict anything, but rather give you framework to trade from. For example: “If this happens…I do this…..and if that happens….I do that.” In this way you are likely to take more high probability trades, and keep emotional trading (which is unplanned and dangerous) at bay.