Okane’s Trend Targeting Price Action Technique
If you have been following my price action trading then you may already know that I prefer to analyze the candlesticks and price patterns rather than following indicator-based strategies.
That’s why I decided to share a technique I use for trading the trends by first identifying support and resistance areas and breakouts. In my opinion, you should already have an understanding of how to draw horizontal lines and be familiar with;
Therefore, I can only recommend my strategy to the more advanced traders.
Anyhow, this is a three step price action technique that starts with finding an area of divergence… or the trend… or the targets. Well, it’s kind of a “chicken or the egg” situation to be honest. It’s like a circle, so it doesn’t really matter where you “jump in”. Just hang tight and follow the instructions and you will see what I mean. In my experience, currencies are the assets that perform best with my technical analysis, especially the EUR/USD.
Step 1. Identifying the Divergence
So what is a divergence? These areas often occur at the end of a trend. Of course, there are different trends on different timeframes. However, during the first step, I like to use the hourly charts to find a trend with clear highs and lows. If the trend is bearish, then you should find lower lows and lower highs. In that case, draw a trend line at the top of the highs (sometimes a mix of candlewicks and bodies). If the trend is bullish on the other hand, then you should see clear higher lows and higher highs and you can draw a trend line based on the higher lows.
Here is such an area on the H1, trend was bearish!
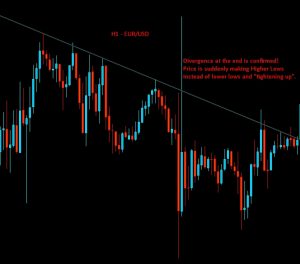
Notice that at the end of the line, at the bottom right, price seemed to reach a strong support and is no longer creating lower highs and lower lows! We can actually see that price is even creating higher lows and higher highs! And the final candlesticks at the end of the trend line are “tightening” up, one goes down, the others goes up as if the market is waiting for something to happen. Yes, in fact it is waiting for a breakout!
At this point, we should get ready with setting up target support or resistance lines. This is step 2.
Step 2. Setting up the Target Lines
Before price breaks out of the trend line, we need to have an idea of where it wants to go. In other words, we need to identify the next resistance or support. In the case above, the divergence was bullish so we were expecting a bullish breakout and hence, we need to draw a resistance line.
This is the difficult part because you must understand where to draw your lines. The easiest way is to look at a few different timeframes such as H4, H1 and sometimes even the daily charts to see where the recent support or resistance is. In the case above, we could easily identify the resistance on the hourly charts based on recent price action history. See the picture below.
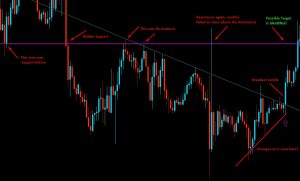 Based on recent price action (support/resistance) we can guess that this is the area price wants to reach once again after the breakout. I have also marked the bullish divergence! You can also see that price went up to our target resistance.
Step 3. Entering Trades towards the Target
Now that we have a target and the trend line is broken, it’s time to trade towards the target resistance and make some money! Once price breaks out, usually there is either a big jump in the direction where price broke the trend line or a “smaller” movement. Sometimes, the price will even fall back to the trend and use it as support, this is a good area for entering the trade so I suggest you don’t remove your trend line yet so you can see the “kiss good bye”. If, as I said before, the jump is sudden and a volatile one, you might want to wait for a retracement first. The picture above shows price providing us with a good opportunity to enter at a higher low after the breakout. I prefer to move to the lower timeframes after the breakout to ride the smaller higher lows (bullish breakout) or lower highs (bearish breakout).
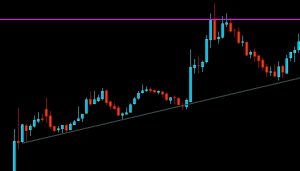
Below is an example based on the M15 but whether you use M15 or M5 depends on where you can place your trend line the best. Meaning where you can best adapt it to the price.
You may find more examples of live trades in my trading diary here as I use this technique quite often. Learn from them!
The Cycle of a Trend
I hope you now understand what I meant with “this is like a circle”. I mean, if price is already trending then you can just use trend lines to take trades towards the target support or resistance line.
If the price is at the end of the trend and diverging after it has reached a target, then wait for the breakout and trade it towards the next target. So where you “get in” depends on what price is doing at the moment of looking at your charts. Use the hourly and above timeframe to set up strong support and resistance lines and use the lower timeframes to ride the trend toward those targets. If you wish to use longer expiries then you can obviously just use the hourly timeframe for riding the trends as well, no problem! Adapt it to your liking and feel free to use a Stochastic Oscillator as an extra confirmation when entering on higher lows or lower highs (also helpful when looking for divergence).