Making Sense Of Market Correction
The Technical Correction-What You Should Know
Market corrections are often very difficult environments to trade it. This is because near and long term factors are at odds with each other. For one reason of another these factors build until eventually one or the other comes out on top. In the recent months, speaking to the correction we have seen in the US markets, near term fears born on the back of geo-political concerns, Ebola, weak global economic data and crashing oil prices. These fears mounted, one by one, until they overshadowed the fact that long term economic trends are up and gaining momentum. This by no means is the underpinning of all corrections, merely my view on the current one. The thing that makes a correction so hard is that they show up quick and move fast once begun, a combination which makes it very easy for even savvy traders to lose sight of the longer term. However, if you can keep your emotions in check there are a number of profitable entries a binary trader can make.
Market corrections can occur in either a bull or a bear market. Corrections occur with regularity within any trend and can be profited from. They are a natural part of any market environment and actually help to strengthen the longer term trend. By definition a correction is a change that rectifies an error or inaccuracy. By extension a market correction is a change that rectifies an error or inaccuracy in market value. This can be due to sentiment or pricing and simply means that for one reason or another market prices were incorrect, and became fixed, correcting to trend. The very best thing is that corrections, like all aspects of technical analysis, are predictable and repeatable giving off regular signals. The hardest part about a correction is knowing when it starts so I don’t recommend trying to trade that move, it will be the follow up action where you find the most opportunity.
Opportunity In Correction
The most common way to judge a correction is by extent. Typically a market is not considered to have “corrected” unless it moves at least 10%, opposite the prevailing trend. This is evident in recent action. The markets were falling hard, and gaining momentum, when the Russell 2000 and NASDAQ Composite touched into -10% territory. This is important to take note of because you can use this number to predict support levels in future corrections.
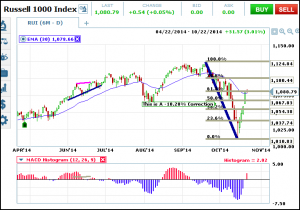
Fibonacci retracement is perfect for measuring corrections
Look at the chart above. The Russel 1000 fell just a hair over 10% where it found strong support. Once the correction began savvy traders could have targeted this level for speculative positions and received near instant reward. The bounce can usually be traded over the next few days or week, until resistance is met and it will be met. Corrections don’t mean that the trend will continue immediately, just that it will eventually. What typically happens is a consolidation period and this is when I whip out the Fibonacci Retracement tool. You can see this on the chart above as well. Once the bounce begins you can use standard Fibonacci signals, one of which will be resistance. Look at the next chart of one hour prices. There are at least 7 clear Fibonacci entry signals over the course of 6 days with more expected.
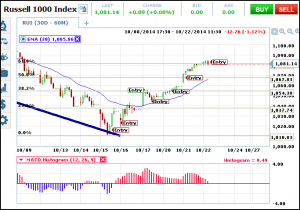
Fibonacci provides multiple entries during corrections
In this example price action has retraced the correction more than 50%. This a very bullish sign but does not mean the index is moving straight up. In fact, based on the MACD, we can expect a retest of support and it might be a strong one. Price action in fact trading right in line with the 62.6% FR level and making a bearsish candle. This is a sign of resistance and the next possible entry point. A put from here can be expected to move into the money in the next few bars with downside targets in-line with the Fibonacci Retracements. My first estimate will be for prices to find support at the 50% line, but if it breaks prices will likely fall all the way back to test the full correction. This next chart is the same but dialed in to one hour candles.
Freak Out Or Make Money?
Well, I hope by now I have helped you to realize that market corrections are nothing to freak out about. In fact, in my view, corrections are great opportunities for quick witted, savvy traders to make some money. Like I said before, the start of correction is hard to judge and can create a panic of its own. This may cause you to lose a trade or two but once it becomes clear the market is fixing a problem you can correct those loses with some high probability trading.