Fibonacci, Reading The Retracements
I know, I know, all of you who have read my previous posts are thinking, “didn’t he say that Fib’s are not signals?” It’s true, I have and it is correct. Just because price action has reached your Fibonacci Retracement level it does not signal an entry.
You must wait for a signal/confirmation from other indicators before entering a position as price could break and pass the retracement as easily as it can bounce from it.
The signals I am referring to are a little more advanced than that and are concerned with which retracement level is in question and what price action does after the signal is confirmed.
It is possible to create a short to long term target based on these two criteria.
Leading Brokers Offering Fibonacci Charting
Fibonacci Levels
Before moving on the individual levels I want to start with levels in general. As I have said many times, a level in and of itself is not a signal but a target level where a signal may form. Once that signal forms you can make at least two predictions.
Which direction prices are going and what the next target level will be.
This is how it works. Once price action has reached or come close to a Fib level it will form either a reversal or a continuation signal.
If a reversal, bottoming or other signal of support develops you can be sure that prices will reverse from that point, at least in the near to short term.
If a continuation signal or other sign of momentum or strength (either bullish or bearish depending on direction) forms, with a confirmation, you can be sure that prices will continue on in the direction they have been moving.
In either case the next price target will be the next Fib level.
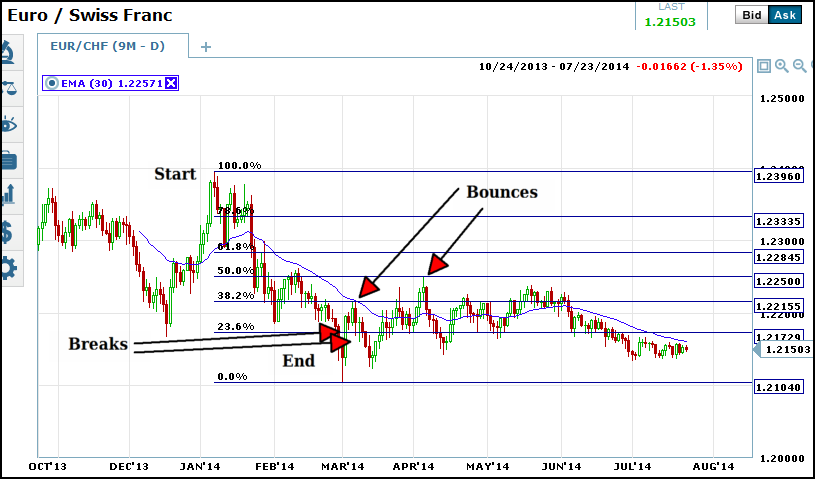
In the case of a bounce it will be the previous level, in the case of a break it will be the next level past the break. As a rule of thumb, either type of signal can form on either side of the retracement level, which is why confirmations are so important.
In my example I use a chart of daily prices for my targets, to gain entry I would move down to a chart of hourly or 30 minutes for confirmation.
Rules For Fibonacci Retracement Levels
Where do you start? First, you must choose a place to use the Fib tool. I have chosen a chart of the EUR/CHF, an asset I never trade.
Fibonacci’s measure a retracement, or reversal, of price so the best place to use the tool is in a trending market. Start at the bottom of a rally or the top of a decline and draw the tool from the starting point to the next highest/lowest peak/trough.
After that it is time to start watching for signals. The 7 Fibonacci Retracement levels are 0%,23.6%, 38.2%, 50%, 61.8%, 78.6% and 100%. 0% is no retracement of the movement, 100% is a full retracement of the move. My signals are focused on the middle 5 levels.
The 23.6% Retracement
This is the first level. If prices retreat to this level and bounce, it is more likely for the underlying to trend than it is to reverse. If prices break this level then the underlying trend may consolidate around that level or reverse course altogether but a consolidation is more likely.
The 38.2% Retracement
This is the second level. If prices have broken the first level this is your next target. At this level if prices bounce then it is more likely that a near to short term consolidation is in play than a major reversal. Prices may hover here or bounce back to the 23.6% level. If prices break this level a deeper correction, but not necessarily a reversal, is in play.
The 50% Retracement
This is the third line and where things can really start to get interesting. As before, if prices break the 38.2% line then the 50% retracement becomes your target.
If prices bounce from this level there is a good chance that they will return to retest support at or near the previous low/high that the Fibonacci Retracement is based on, or the 0% line.
If, however, prices break the 50% line then all of a sudden a full 100% retracement becomes a possibility. A break of this line indicates an underlying strength/weakness in the market, depending on which direction the retracement is moving.
The 61.8% Retracement
This is the fourth level of retracement. If price breaks the 50% level this is the next target and may be reached very quickly as momentum traders get on board.
Once prices reach here the underlying trend is broken and over. Prices may consolidate along this level, move higher and retest the 50% level or continue on to the next level and possible full retracement.
The 78.6% Level
This is the fifth and final level, not counting the full 100% retracement. If prices break the 61.8% level this is your target, and like the previous level, prices may reach this level with a quickness.
This level can often become support/resistance in a longer term sense once prices reach it. A bounce from this level will usually mean a longer term consolidation while a break of it will lead to the next target, the 100% retracement.