An introduction to harmonic patterns
When all match, you have a sure profit: An introduction to harmonic patterns!
Hey Traders,
I want to share with you a strategy which is very old (1935,”Profits in the stock market” by H.M Gartley) and it still works with very good results but first let’s take a look in my trades.
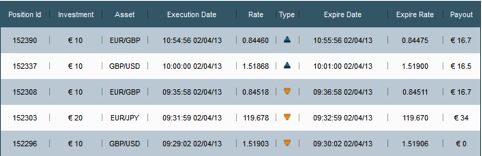
The trades are from 2/4 and my perfofance was 80%. I predict right in 4 of 5 trades.I think it’s a respectable performance. Just kidding!
Now, let’s talk about the serious issues. “Harmonic Patterns” is an advanced level of technical analysis. You need to know to use very well fibonacci retracements and extensions,to identify how the price acts near support and resistance and overbought/oversold conditions. You can find this information in my first two articles with screenshots. Let’s go to see a screenshot.
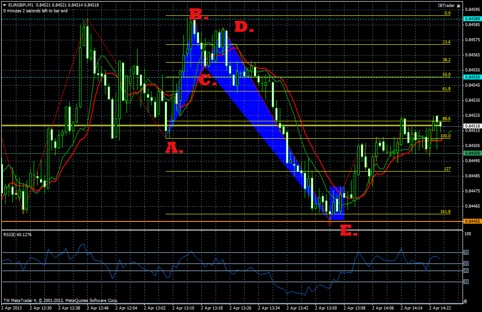
This is my trade EUR/GBP and I was 99% sure about this setup, so I took the trade and I was waiting confortable one minute to be ITM, and it was. This pattern is “The Crab” and it’s a harmonic Pattern.For me, this pattern has the biggest success rate. Look at the letters in the screenshot. We have four pairs of letters, A-B , B-C, C-D and finally D-E. I use these letters but you can use the letters you want.You can see that D-E is fib extension 161.8 of A-B, B-C is a 38.2 fib retracement of A-B and C-D is a 88.6 retracement of B-C. When the letters have these retracements and extensions we should expect a reversal in letter E and maybe the beginning of a new trend. Because the trend will be up, this is a “Bullish Crab“.
This is a very good tool but you should always have a confirmation. In the screenshot you can see the orange line.It’s previous day low, a very strong spot for reversals as I said in my 2nd article. The price hit the first time 161.8 fib and we have our harmonic pattern ready. But the question is when you should take the trade.I was waiting for the price to hit the previous day low because in this case is a stronger level than 161.8 fib extension. Our RSI was extremely oversold a signal of reversal,too.Finally the price hit the orange line and a made a big reversal up in the next candle. You can see that now we have the beginning of a new uptrend and it has at least 30 minutes duration.You could take a call with 1 min,5 min,10, min,15 min or 30 min expiry. It will ITM in every case.
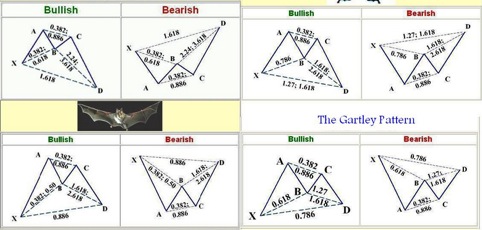
Here is a picture with other harmonics. There are free software for harmonics but I don’t trust them because many patterns are wrong.They don’t have the accurate retracements and extensions and they fail. So, the best choice for me is to draw by yourself. Of course, you can use the free indicators but you should always check if the patterns are right.
Kind Regards,
Kostasze