ALWAYS wait for the candle to close
1-24-2012
Hello everyone, hope everyone has learned a thing or two by reading my blog. I’m about to make a transition to discuss one high probability trade a day instead of constantly covering many trades in one post. I believe if I focus on one high probability trade and discuss why I placed that trade I can better explain myself. I will occasionally post about several trades but for the most part I will focus on single high probability trades. I’m still not profitable, but I am about break-even ratio. I’ve been trading for almost a year, and I’ve learned a lot along the way, but I have much more experience and screen time to go, and I wont give up. I think that you need to be persistent if you want to learn how to trade profitably. After all if it was easy, everyone would do it and no one would be rich, because you have to have two people to complete a trade. One will be right and win money and the other will be wrong and lose money. The ultimate piece of knowledge to learn in trading is how to piggyback the large institutional moves, because they are the ones that “move” the market, so it pays off to learn how to follow them.
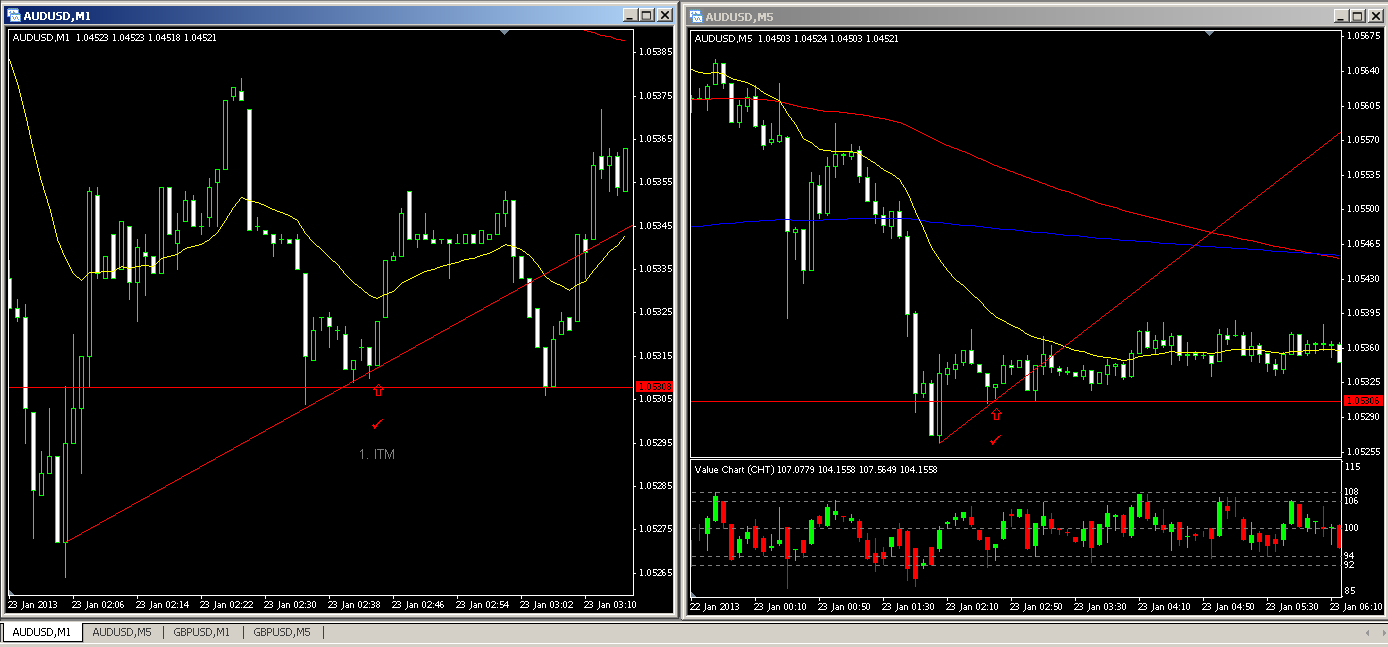
On the 22nd I placed one trade on the AUD/USD pair. Looking at the chart we see price made a sharp bearish move and had a correction shortly after, so I waited to see what price would do, and there are three outcomes that could happen. Price could resume the previous bear trend, price could reverse in the opposite direction, or price could range for a while. Price entered into a range (like it does a lot after a strong move in either direction according to Al Brooks), Well as I was waiting for price to make a move, it returned back down to try and retest the low, and on its way it met with a lot of support (rejection of lower levels) and I waited for that bar to close. As the next bar formed it tried to move down again and saw the same rejection that the previous candle ran into. This meant the bulls temporarily saw this level as a good place to enter their longs, and to make things even more probable, there was a bullish pinbar that formed, price was away from the 20 EMA, and the Value Chart was in the 92/94 range which signaled possible oversold situation. The Pinbar was my signal candle, I entered a call here and it was ITM. Remember, ALWAYS wait for the candle to close if you are contemplating a trade because the candle can change direction in a heartbeat, you need to see what the final close of the candle is to get an idea of what price is likely to do.