A Working Binary Options Strategy By Okane
Having a working strategy is one thing, but knowing how to use it is another.
I’m going to guide you through my strategy that I use for trading currency pairs.
But you will have to practice and spend time to master it before you consider trying it out on your live account. If you are just looking for a “system” with arrows pointing where to take Calls/Puts you will have to keep looking… This strategy requires patience.
The MT4 Setup
-Choose Candlesticks
-Add Stochastic Oscillator, Stoch(5,3,3) Levels: 80 and 20.
-Add RSI(4), Levels: 75 and 25.
-Add Exponential Moving Average. Period: 50, 10 and 5 (10 and 5 are Optional)
-Add Fibopiv_v2 (Optional) – I recommend this Support/Resistance indicator,
you can google fibopiv_v2 or just click here: http://codebase.mql4.com/3002
Here is how my charts look like:
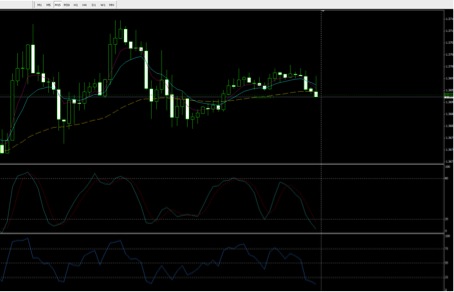
OBS! Don’t zoom in too much. I only zoomed in for the sake of the example. Golden line, 50EMA. Aqua, 10EMA and Violet red, 5EMA. Stochastic and RSI are also visible. The Fibopiv is not entirely visible.
How to spot possible entries
This is a very simple strategy, just a few indicators.
What we are looking for is confirmation! I like confirmation, not anticipation.
Since I started using this strategy I’ve become better at finding accurate entries for my trades.
I recommend that you start with just 2-3 currency pairs to begin with. Monitoring too many charts is confusing and stressful and you will miss out on trade opportunities.
Okay, let us go through all the necessary steps and look at a few pictures.
- I recommend, especially if you don’t want to use the fibopiv, that you start by going to the daily chart and drawing Support/Resistance lines, then change back to lower timeframes, H4, H1, M30 and M15 and repeat the process of drawing S/R lines that seem important.
- Go to the 15M chart and study the chart. First confirm the trend. If it is an uptrend then you should clearly see higher highs and higher lows. If it’s a downtrend, look for lower lows and lower highs. Here the 50EMA helps, are the highs and lows below the 50EMA then we are probably still in a downtrend, are they above the 50EMA then we are probably in an uptrend.
If you can’t really tell which way the price is trending, we are dealing with an undecided market. You are better off not trading until a clear trend is observed!
- When a trend is confirmed we wait for a retracement. The goal is to catch the end of the retracement and get on the trade in the direction of the original trend.
This is where RSI and Stochastic Oscillator will play a big roll. We will look for oversold/overbought areas. If we are to catch an uptrend, we obviously want the RSI to touch or go below 25 and the Stochastic to touch or go below 20. But that’s is not enough to enter a trade! See the picture of USD/JPY 15M chart below.
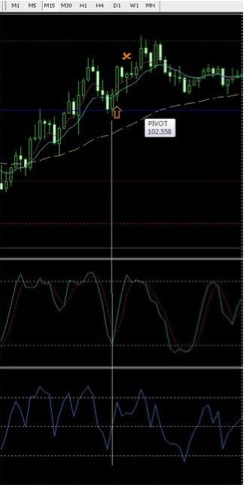
Notice how the candles have been making higher highs over the 50EMA.
Also the Pivot line (fibopiv) has become a solid support. See vertical line!
Stochastic and RSI are oversold. Arrow was my entry for a Call, star was my expiry.
- So far we have confirmed the trend (up/down). We think the retracement is about to be over because Stochastic and RSI are telling us that. We need yet another confirmation to proceed. This is where our S/R lines will come in handy! Start drawing S/R lines on the 5M and the 1M chart. These are for spotting our entry. We want to see if S/R lines are likely to be broken or not. Now it’s the time to put your candlestick knowledge to use! Don’t get into trades if candles are mostly undecided, dojis for example… I usually wait for at least a good 5Minute candle to finish above/under (depending on wether I’m trading a Call or a Put) previous candles.
Here is another example:
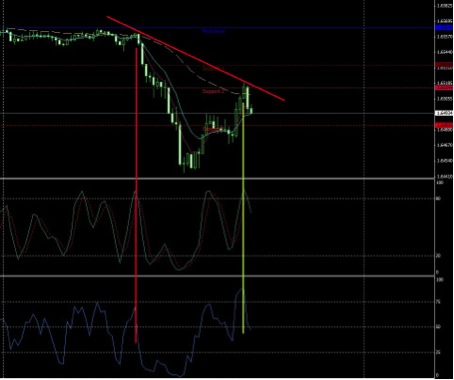
Picture of the 15M chart of GBP/USD 20140130. A winning trade I took that day.
The vertical yellow line is for showing that at the moment I was looking for an entry I saw Stochastic Oscillator and RSI hitting overbought levels. The high is also lower than previous high, see vertical red line! Third confirmation was my support line (the fibopiv_v2). As you can see the first S1 could not hold so I had to confirm whether S2 would be stronger or not.
Then I changed back to 1M chart. See next picture below.
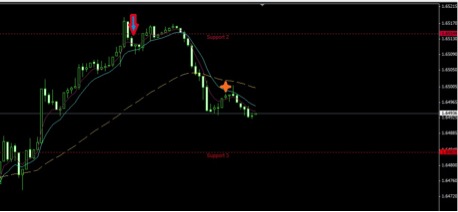
The 1minute chart of GBP/USD. Now you can see the Support 2 clearly! Notice how bullish candles tried to break above it but failed. Arrow is my entry and the star is the expiry.
The expiry time for this trade was 30 minutes because I was worried that the price would try to break above support one more time before getting pushed back down. As you can see it did go for a second attempt on breaking the S2.
For this trade everything was in accordance with my strategy.
The Stochastic and RSI being over the overbought levels, I spotted a lower high, support line held and candlesticks closed under the support line indicating strong resistance.
The good, the bad and the ugly
The good part is of course, as I mentioned earlier, all the confirmations that this strategy provides the trader with. Confirmation leads to confidence and a confident trader makes less mistakes!
On the bad side, not getting that many trading opportunities can be a problem for some traders. Personally I don’t care how many trades I make. The most important thing is executing a trade with correct analysis. However, not getting many opportunities can lead to impatience, which can force an inexperienced trader into trading without confirmation. This can turn…hmm… Ugly.
In conclusion, this strategy can work for you if you are willing to put some time practicing your charting skills!
Since we are dealing with probabilities we can never be 100% sure that the trade will go as planned.
However, by mastering a working strategy and sticking to your rules you can at least be sure that the majority of your trades will end in the money.
As I advised you in my last post you can speed up the learning process by keeping a diary.
Let me know if you have any questions. See you in my next post!
/Okane