3/5 ITM
3-6-13
Good day traders, hope everyone had many profitable trades today. After much thought, I believe I will try live trading soon. I’ve been demoing for about a year and the past several months I have been able to produce more winners than losers cumulatively. There is a psychological barrier that separates a demo account from a live account, and that’s simply because with a live account, your dealing with your heard earned cash, instead of fake money that has no effect on you. I want to demo live starting with just $1.00 trades, and work my way from there. I will let everyone know when I make the transition to live. Until then I’m still on my binary options demo account.
Today I made a total of 5 trades, and 3 of them were ITM, I’d say its not a bad day, its always a good day when you have more winners than losers. My first AUD/USD trade for the day I followed my strategy to a T, but I still lost, there is NO strategy that is 100% accurate in trading, so I took the loss and moved on. My analysis on this trade was simple, Price was in an overall downtrend as indicated by higher TF’s and the 180 and 365 EMA, price had broken down through the 20 EMA and retraced back up to test it again, the Value Chart was forming a lower high also signaling a sell. I entered a put right after the candle that touched the 20 EMA, but unfortunately the next candle price moved back up, as the bulls were not finished yet. There really wasn’t much I could have done, there was even a resistance level that aligned with the 20 EMA, so I took the trade, it seemed like a highly probable trade, but you cant win them all.
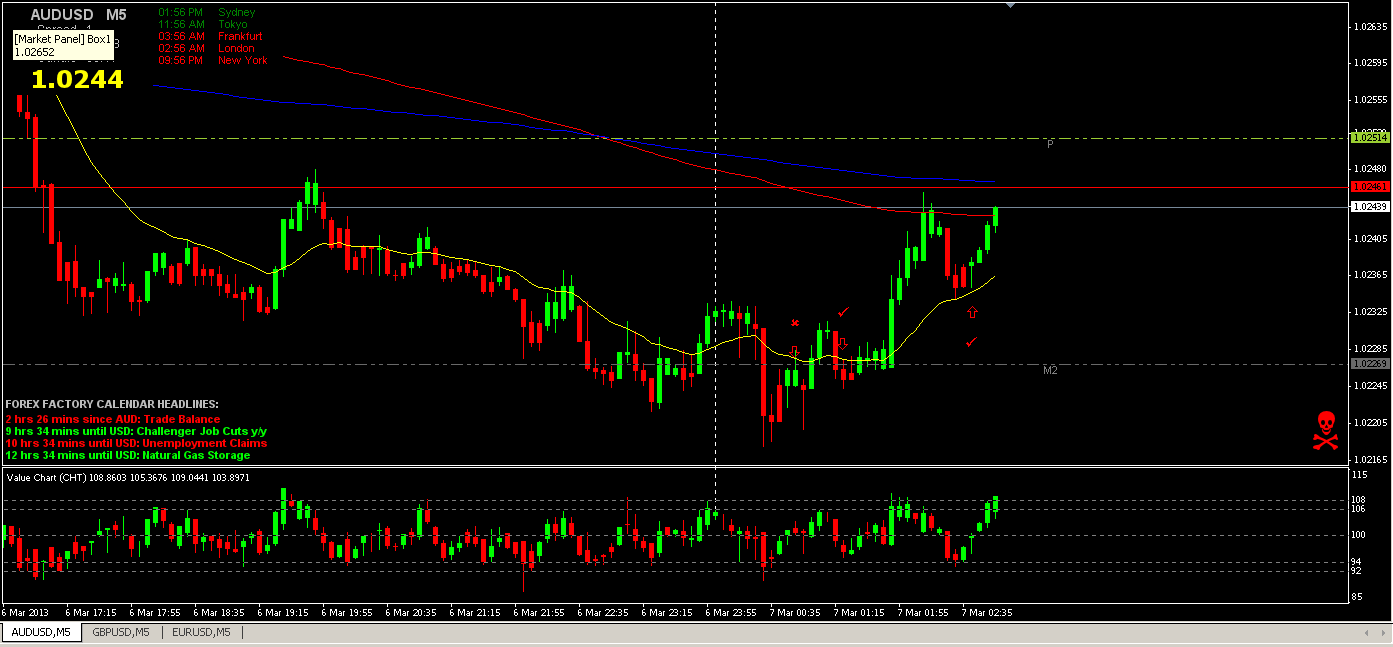
My second AUD/USD trade I still was looking to place put trades because the overall trend was down, and I prefer to trade in the direction of the trend. I waited for price to finish the pullback it made after my previous trade. A Doji formed, telling me there was a small trading range on the 1min chart where bears and bulls were fighting, this signaled to me that the bears had enough and wanted to regain control after the bulls had a nice rally up. The next candle is where I entered as it turned red, Value Chart was at an ideal level, price was away from the 20 EMA (reversion to the mean), and it was above the support level, and I figured it would test it again. Trade was ITM by about 3 Pips.
My third trade was with GBP/USD, and it was OTM. I did follow my strategy with this one, but there was something else I should have paid closer attention to. My analysis was similar to my last trade, price was in overall downtrend, 20EMA was being respected every time price came up to it, Value Chart was at an ideal level, candle turned red, all signaling to me a good Put trade. I did notice there was a double bottom, where price tested the support line and bounced twice, I should have took this as an indication price was going up due to the strong rejection of that level. Oh well, I learned from this trade at least.
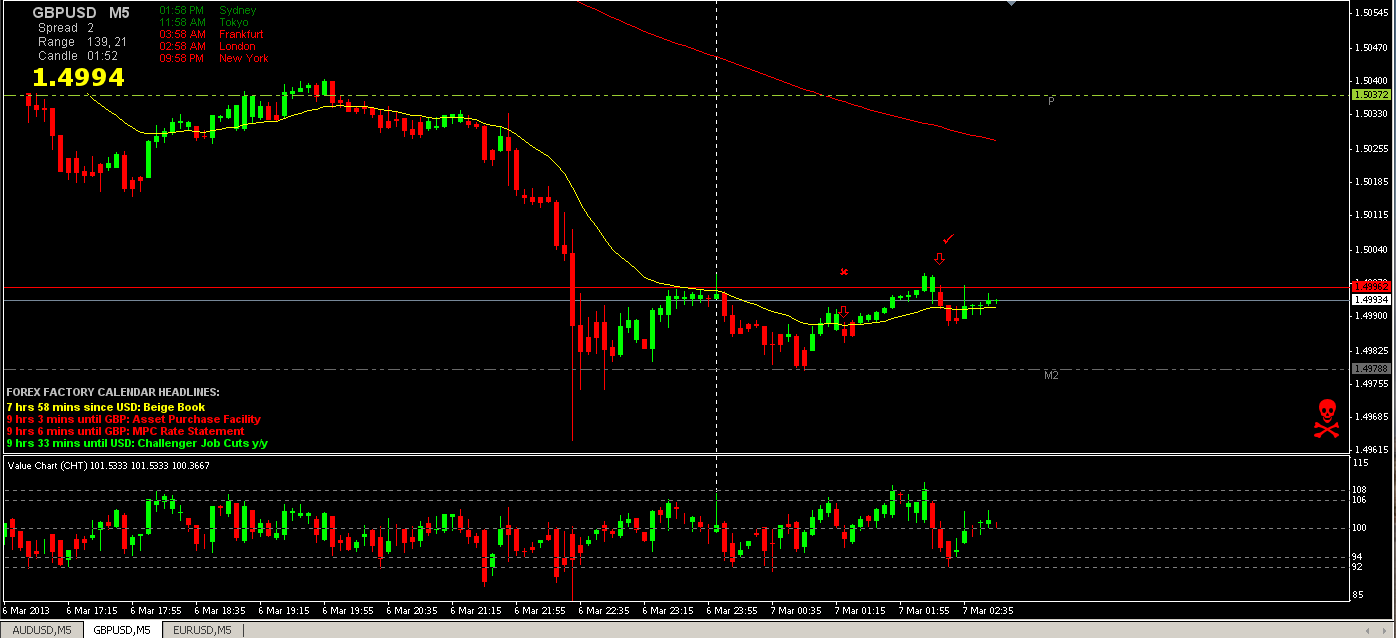
My fourth trade was with GBP/USD, it was ITM. Even though bulls were taking control now, there has to be pullbacks along the way, so I was looking to trade a pullback. For the last 50 minutes price was rallying up and I waited for a nice pullback to the 20EMA. After the second green candle that failed to make a higher high, I was looking for an entry around that area. Once the next candle turned red, the value chart began to drop, I entered my trade.
My fifth and final trade for the day, I went back with AUD/USD. This trade was ITM and was my highest probability trade of the day, just for shear simplicity. The bulls were in control now, and price was heading up to the 180 EMA, I missed the put off the 180 EMA because I was eating dinner, but I looked for another trade. Price came down and touched the 20 EMA, and didn’t close below it. The Value Chart was very clear and gave me more trust that price would bounce off the 20EMA. Once the third candle turned green and price started moving up, I entered.