The Fibonacci Long Bar Method
The Fibonacci Long Bar Method is a style of trading with Fibonacci Retracements that I have developed over the years. This method focuses on day and day to day trading utilizing retracement levels following a sharp single day rally or decline. This method is not suitable for everyday use but is quite handy at pinpointing super short, near and short term entries in a rapidly moving market. Why is this? Because the most likely time to find a significant amount of retracement is after the market makes a larger than normal move. What exactly is a retracement is a question you may be asking yourself so I will begin with a quick look at Fibonacci and market retracement before illustrating the technique.
-
Retracement – A temporary reversal in asset price reversal that is counter to the prevailing trend. Retracements are not necessarily reversals but can lead to reversal. The amount of retracement can often provide clues as to whether the counter trend move is one or the other.
-
Fibonacci – Was a Renaissance era mathematician who widely disseminated the theory and math behind the Golden Ratio. The Golden Ratio is a mathematical relationship found between everything in nature. Fibonacci Retracements are projected target levels for possible retracement based on the math of the Golden Ratio.
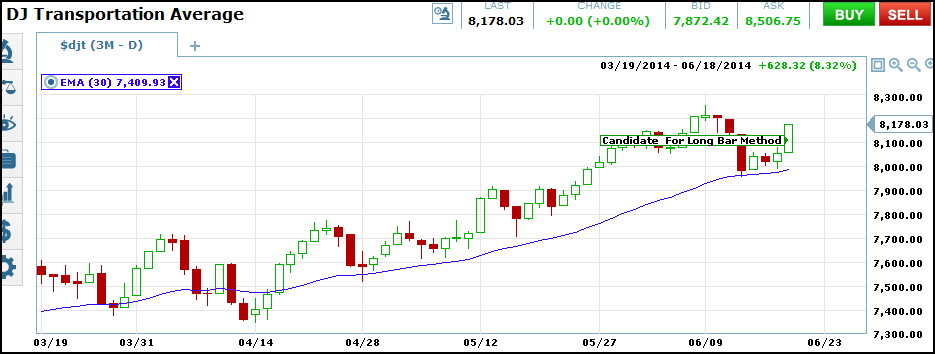
Because retracements are temporary dips in asset price counter to the prevailing trend for this method we are going to use the direction of our Long Bar to set trend for our day trades. The first thing to do is to identify a Long Bar. We will do this on a chart of daily prices. The Long Bar could be a long white or a long black candle and should be noticeably longer than other candles over the past few months. I suggest waiting for a candle that is at least a 1% movement of asset prices, more is better and will result in a stronger retracement/test of support/resistance. I say test of support/resistance because that is what a Fibonacci Retracement (FR) level really is, a target at which you may expect to find either support or resistance. Keep in mind that an FR is not a signal, it is a place where a signal may be found. There are some loose rules concerning the FR’s but again, they are not signals. One such rule is that if a FR is broken and confirmed the next FR will be your target. Another rule is that if an asset only retraces to the first FR it is more likely to continue on in the direction of the underlying trend than to reverse. Look at the chart of the Dow Jones Transportation Average below. I have identified a potential Long Bar. It’s not super long but is noticeably longer than the average candle stick.
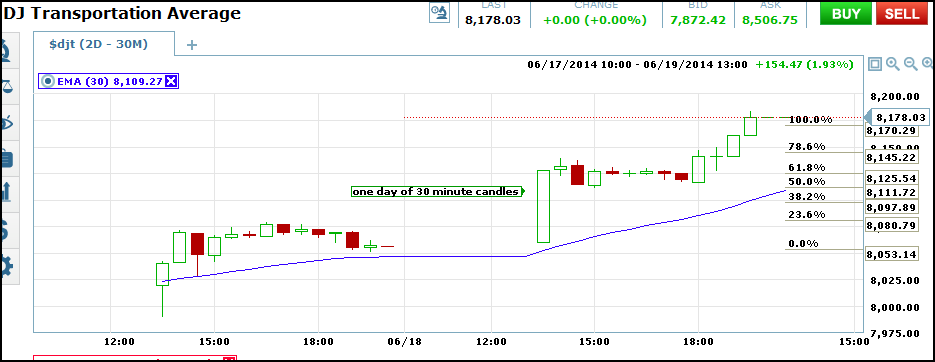
I always start before the market opens, that’s when I find my Long Bar and prepare for trading. Once a bar is identified use the Fibonacci tool to draw a FR in the direction of the candle. Once this is done you can move down to a lower time frame chart, one that is suitable to your style. I use hourly, 30 minute and 10 minute but take most of these signals off of the 10 minute chart. The chart below shows the long bar broken into 30 minute candles with the Fibonacci Retracements in place for the next day’s trading.
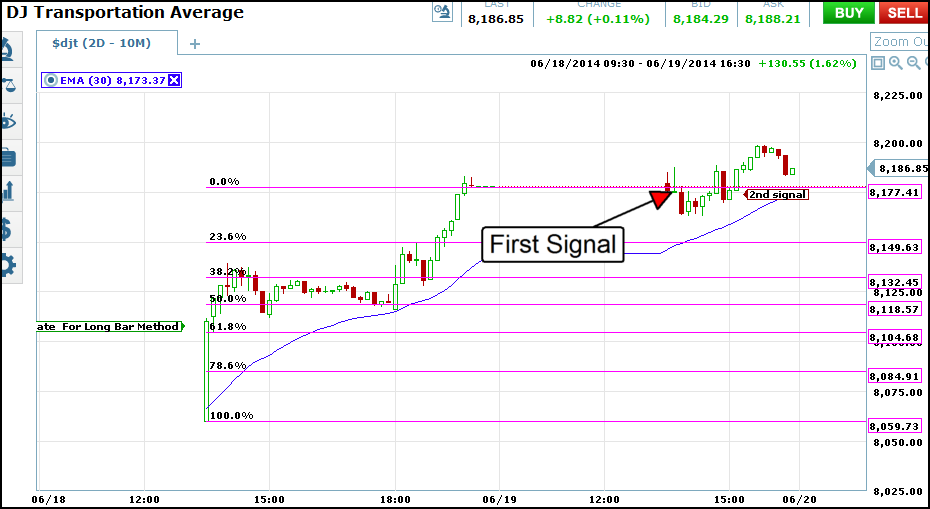
You will begin to get your first signals at the open, even before the open. Futures trading will indicate if the asset will open higher or lower than the previous days close. Look at the chart below. The first signal occurs in the first ten minutes of trading. The asset opens above the previous close and then moves below with the candle closing below. The next candle is Tombstone Doji confirming the resistance level of the previous close. Entries can be taken for bearish positions with 10 to 30 minute expiry at this signal. Later on asset prices find support before even retracing to the first level, 23.6%, a very bullish sign. The next signal occurs once prices break back above the previous close. The first break is a weaker signal and can be taken with longer expiry, the second strong signal can be taken with shorter expiry. If you look closely a third signal is beginning to set up as prices retrace back to the previous close, now support.
It is most difficult to use this strategy if you use it by itself. Fibonacci’s are a great trading tool but need confirmation of other indicators such as stochastic, MACD, Moving Averages and other standard tools. Notice in my charts how the 30 bay EMA helps to support the asset price as it moves higher.