My Approach to Forex Trading #4: Trades on the GBP/JPY
In this post I’d like to talk about some forex trades I made on the GBP/JPY in 2013 for those of you interested in further examples of how I approach spot forex trading. The GBP/JPY is well known as a volatile pair. There is a lot of movement of all timeframes, which I experienced when trading this pair for short-term binaries in the past (back when 24option accepted U.S. customers and had the GBP/JPY as one of its best-paying assets).
Finding solid price levels to trade on the GBP/JPY has been difficult lately because it’s mainly been an uptrending pair insteading of bouncing between levels. The British Pound has been one of the hottest currencies on the market recently and we’re currently seeing highs on the GBP/JPY that haven’t been seen since the late summer of 2008. As such, if the goal is to find Fibonacci retracement levels that could be effective for trading this market, I would have to find large-scale high and lows that encompass 2008 price data.
The only Fibonacci retracement levels I found suitable for my GBP/JPY chart at that time (and currently), ranged from 116.827-251.090, with that low being set in September of 2011 and the high being set in July of 2007.
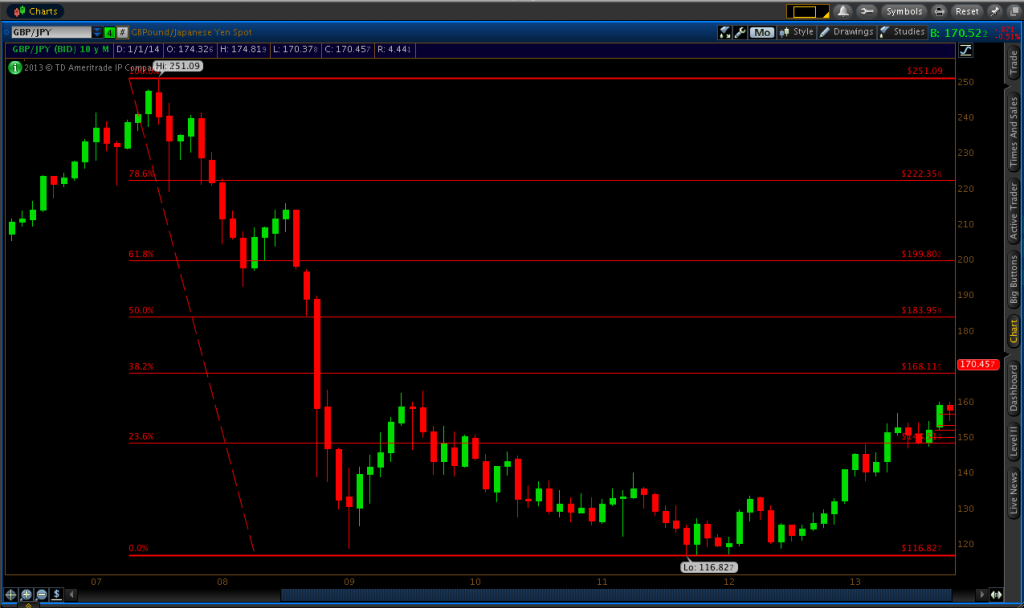
During the summer of 2013, price hovered around the 23.6% Fibonacci retracement level (148.513) created from that price span. Back in April I had a sell limit order set at 148.513 in anticipation that this level could act as a resistance area and act as a price reversal. However, I was wrong and this trade was quickly stopped out as price emphatically flew right through it.
Once price settled above the 23.6% Fib, I began targeting that level for a buy limit order, believing it could act as a place where price could retrace back down to before resuming the uptrend. My trade first triggered back in June and went in my favor, but the market still kept on coming back down to the 148.513 level so it hit my trailing stop for essentially a break-even trade. A week later I manually entered myself into essentially the same trade (actually a bit below the 23.6% Fib level) and this too met the same fate as the earlier trade. About a month later it hit my trailing stop for a 50-pip gain, which is essentially negligible for long-term spot trades.

I got into a buy order trade at 148.513 again on July 31. Like the previous two buy order trades at the 23.6% Fib level, I had my stop-loss set at 146.244, just below the recent lows from last April. This is the level at which, if touched/broken, would likely invalidate my belief that the GBP/JPY was bound to go higher. I had my take-profit level set at 153.664, or at the top of the recent resistance level, which had seen multiple recent tests. However, I would later get rid of that and just use my trailing stops to dictate how much profit I would make. In my opinion, this is a fair maneuver when dealing with strongly trending markets when making highs or lows that haven’t been seen in several months or years. You simply don’t know of a reasonable price where price could reverse on you. Hence, sticking with trailing stops is your best bet.
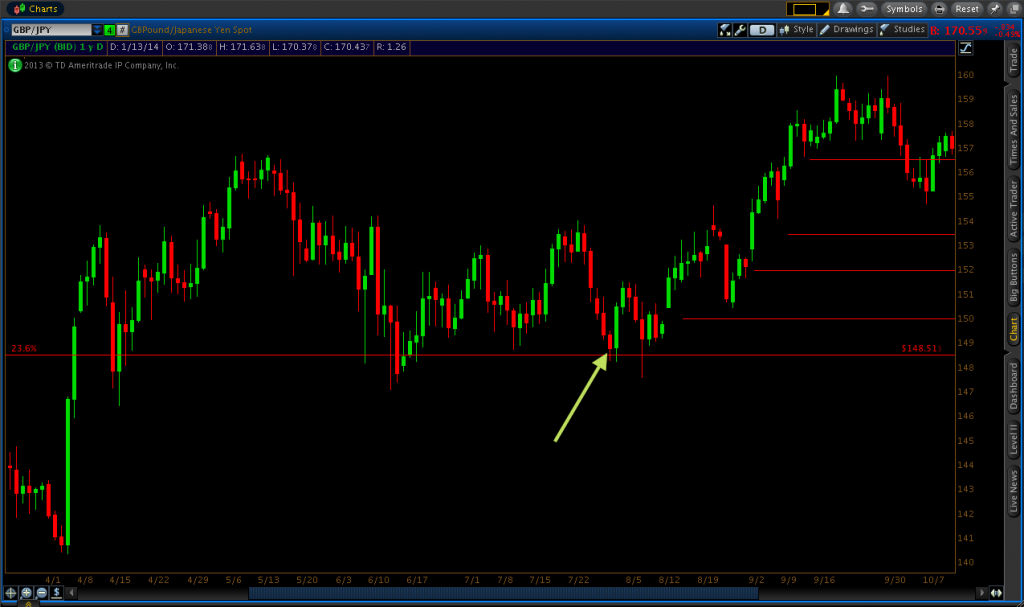
The trade went in my favor much like the previous two trades. My first step is usually to place my trailing stop at break-even for any trade that goes in my direction. I did this after 100 pips was seen in my favor. Following this, on August 15 I set my trailing stop at 149.850, just below the 150 whole number, to lock in approximately 150 pips of profit.
Once 153.664, my original but now removed take-profit level had been breached in favor of new highs, I knew I finally had a great trade on my hands with this pair. On September 4, I adjusted my trailing stop higher to 151.985, locking in nearly 350 pips of profit. I adjusted this up again to 153.466 on Setember 9, and then all the way up to 156.524 on September 19, in rough accordance with the annual highs that had been seen back in May. My trailing stop was finally hit on October 4. In just over two months, I had netted roughly 800 pips from this trade after taking a net loss on my three previous trades after a relatively mild initial 225-pip risk (almost a 4:1 reward-to-risk ratio).
In the image below I’ve paired each of the trailing stops with the price candle that corresponds to the date at which I adjusted each stop (with blue arrows).

So although we’re just four posts into my series of spot forex articles, you can see that the power of using Fibonacci retracements on the higher timeframes can be an enormously valuable tool to help find levels in the market to trade from. Fibonacci lines from the monthly and weekly timeframes work best. You might go months with price hanging between levels, so your trades using Fibonacci lines as the base might be infrequent, but if you play the trades right – that is, reasonably setting up stop-loss and take-profit levels and appropriately setting trailing stops as needed – they can be some of your best.