The Vortex Indicator – A Simple Trend Tool
The Vortex Indicator helps isolate trends, which can aid new traders in determining when a new trend is likely underway. The Indictors is based on a two lines–an uptrend line and a downtrend line. When one crosses above the other it indicates that trend (up or down) has taken over. It is also used to spot price congestion, so you can avoid taking trend trades during that time.
Vortex Indicator
The Vortex Indicator is composed of two lines–typically colored green and red, and labeled VI+ and VI-, representing up moves versus down moves.
When the red line crosses above the green line it indicates a downtrend could be beginning on the timeframe being watched. As long as the red line stays above the green line, the downtrend is in effect.
When the green line crosses above the red line it indicates an uptrend could be beginning. As long as the green line stays above the red line, the uptrend is in effect.
Figure 1 shows the Vortex Indicator in action on a 15-minute chart of the USDJPY.
Figure 1. USDJPY with Vortex Indicator
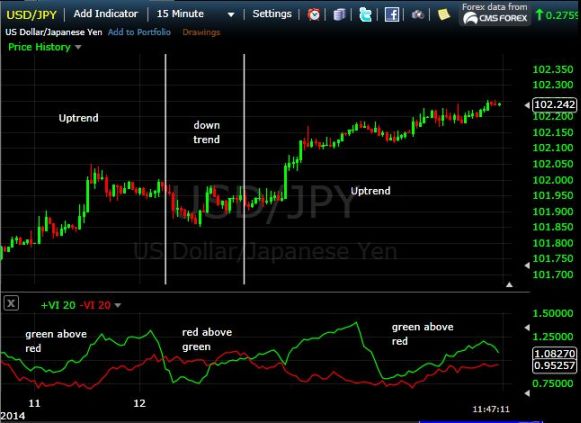
Over this period the pair was in an overall uptrend, so the indicator was effective in isolating the major trending moves higher and also the pullback.
Vortex Indicator Variables
The look back period for the indicator can be adjusted. In figure 1 it is set to 20 (notice it says +VI 20). This means 20 price bars are calculated into the indicator. Change it to 14 and 14 price bars are included in the calculation.
14 is the commonly used look back period, although for short-term trading this may provide too many whipsaw signals.
Increasing the look back period smoothes out the lines, resulting in fewer crossovers. Decreasing the look back period results in more crossovers. Depending on your trading style, you’ll need to test which look back period works best for you. You may find different look back periods work well on some assets but not others. This means you may want to use different settings for different assets.
Spotting Congestion
When both lines are near 1.00 and/or moving back and forth across each other, it notifies you that no trend is present at that time. If a trend trader it is best to not trade during these times.
Avoid trend trading at times when there is little separation between the two lines. When the two lines have more separation between them it indicates a stronger trend is present, and may warrant trading.
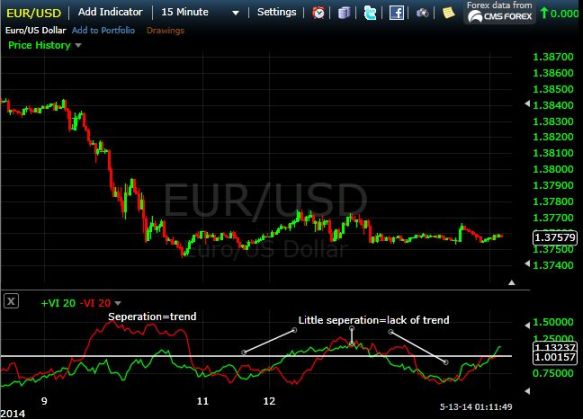
Figure 2 shows how the Vortex Indicator looks in both a trending and sideways market.
Figure 2. EURUSD with Vortex Indicator
Final Word
This indicator isn’t going to make you a star trader. It is prone to providing false signals, and reversal signals may also appear rather late in a move. Adjusting the settings may help reduce the number of false signals. The indicator works best in trending markets, but also helps show you when the market isn’t trending. Look for crossovers and separation to indicate trend trades; tightly intertwined lines indicate a lack of trend.