EURUSD Day Trades – Front-Running Breakouts
January 6 was an interesting day, as it directly related to several articles written recently.
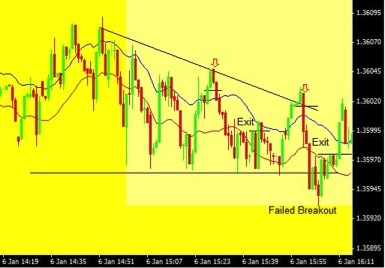
As the US session began today the EURUSD was moving within a triangle pattern, following a trending move down. The expectation based on the trend was that the price would break lower out of the triangle. Therefore, using the strategy discussed in How to “Front-Run” Triangle Breakouts, two trades were take near the top of the triangle in order to get advantageous pricing for the breakout lower. On both attempts lower the price failed to follow-through and the trades were exited with a small profit.
Even though the expectation that the price would drop, it ultimately has to do it. If it doesn’t, get out. By front-running the triangle breakout, two profitable trades were made. Had only the actual breakout been traded, it would have resulted in a loss, since the price didn’t end up going lower. It had a false breakout and then proceeded higher.
Figure 1 shows the first two trades. Arrows mark the direction of the trade and approximate time; the little horizontal lines represent the entry price and exit price.
Figure 1. Front-Running a Triangle Breakout
After the failed breakout the price proceeded to rally quite aggressively. While I wanted to get in on the rally, the price didn’t pull back quite far enough to reach my order. Figure 2 shows this.
Figure 2. No Fill
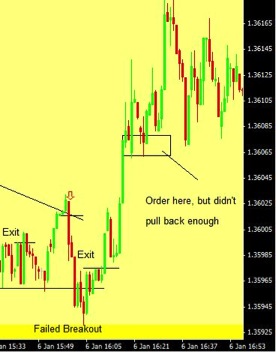
The price pops higher, pauses then pops higher again. It then pulls back to the same low as the prior pause (rectangle). I placed a buy order near those lows (in the rectangle), because it was now apparent that this was likely just a consolidation before another move higher. My order went unfilled and the price moved up. On some days I would just market buy once I saw I was right, but since it wasn’t a very volatile day chasing the price would have likely eaten up too much profit.
As the price action continued to unfold, another familiar pattern emerged–the Head and Shoulders Continuation Pattern. While the head and shoulders is often viewed as a reversal pattern, it can also signal a continuation. Notice the strong rally heading into the H&S pattern, and also that the pattern isn’t very big. In other words, it’s likely just a complex consolidation before the price proceeds higher.
Figure 3. Head and Shoulders Continuation Pattern Trade (front-run)
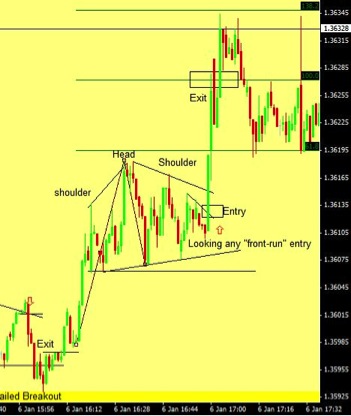
Even though expectation is higher, a high probability entry is still needed. For me, that didn’t occur until the small rectangle marked “Entry.” With the price making higher lows, and the overall expectation higher, the price is getting wound like a spring. Once is starts moving back up after making another higher low the odds are very much in our favor. A Fibonacci Extension tool was used for the exit. Good locations for the stop were just below the higher lows, or just below the horizontal black line which marks the overall bottom of the pattern.
Final Word
Paying attention to overall price structure and managing expectations is far more important than any trade signal. I try to “front-run” and get great price with very little risk by thinking about what I expect the market to do, and then figuring out the best entry strategy. Usually that is not right at a breakout point. If the expectation doesn’t work out, and the price doesn’t follow-through, I get out. With the advantageous pricing the trade has good chance of being profitable, or only a small loss, anyway. Pay attention to strong price moves, and in which direction they are moving. This will help manage expectations even when the price seems to be moving in rather complex formations.