Day Wave Trading With Fibonacci Retracements
Day Wave trading, or more accurately day to day wave trading, is a short term trading method I have developed utilizing Fibonacci Retracements. For those of you who don’t know Fibonacci Retracements, or FR’s, are a method of predicting and projecting potential areas of support and resistance on a chart of asset prices. The levels, or retracements, are based on the Golden Ratio and correspond to mathematical relationships found throughout nature. The ratio of your arm span to your height can be expressed in this manner the same way as the spiraling pattern of seeds in the head of a sunflower. FR’s have been used as a trading tool for decades if not longer and can be one of a traders best friends if used correctly. What do I mean by correctly? I mean that you must use the Fibonacci tool as a projection of areas where signals are likely to occur, not a place where signals will occur or worse yet, treating the retracement levels as signals themselves.
I find that this method is most useful in a range bound or sideways trending market because the asset is likely to move through the retracement levels over and over again. This method does work in a trending market as well but you must be very cautious when trading against the underlying trend. I like to use charts of 1 hour or 30 minute candlesticks, depending on the asset, the MACD histogram and the slow stochastic oscillator. Like I said before, an FR level is not a signal. When price reaches that level it does not mean buy or sell. A retracement level is a place where a good signal is likely to form, I use the MACD, stochastic and other analysis to create my actual trades. Because this method works well in range bound markets or simply assets that do not have large movements in price it is particularly good with forex and forex binary options. Currency pairs tend to trade in tighter ranges compared to stocks, commodities and stock indices.
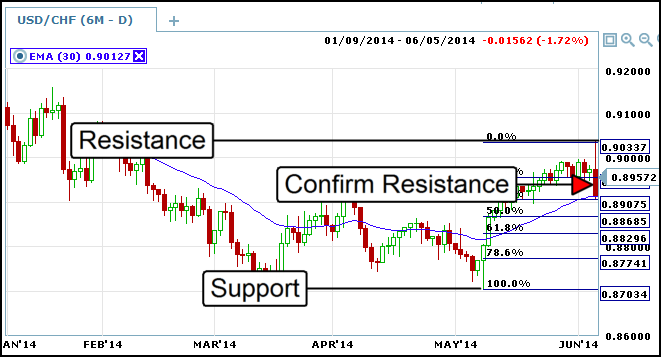
For this method simply start with the daily chart and pick a likely asset that is trending sideways and/or ranging. I have picked the USD/CHF because it has been moving in a range between 0.87 and 0.90 for about four months. The pair has just hit resistance at the upper end of the range and is now a really good candidate to make a move back to the bottom of the range making period stops at or near FR levels. On this chart you can see how the asset makes a series of movements up and down in between the two extremes of the range. These movements tend to have peaks and troughs that are the “day waves”. You can see that the pair trended up to the top of the range from May to June and then at the extreme right of the chart has confirmed resistance at the top of the range. This is a sign that the asset is going to retrace at least a portion of the range, if not the entire range. Now is a good time to use a Fibonacci to project some levels at which we may find a signal. In order to find signals day traders can now move down to a shorter term chart.
Let’s take a look at the chart below. I have now moved down to a chart of 30 minute candles in order to look for day trading signals. Notice how the pair opens at or just above the 38.2% retracement. This is a good place to start looking for signals or at least signals for signals. In fact, the opening is in itself a potentially good signal simply because we can see that the pair found support in the previous session at the retracment level. Any time the pair is near this level, until it shows sign of breaking through, will be a good entry in this example.
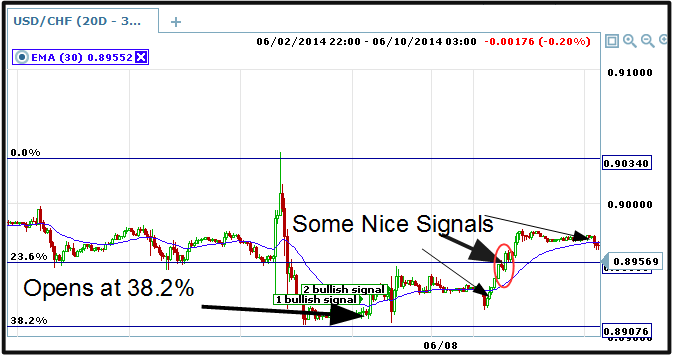
Soon after the open the asset makes two bullish signals that indicate the pair is likely to move back up to retest resistance which we could expect to occur around the 23.6% level. These first signals are the toughest to catch and trade on but once you establish support or resistance at one of the FR’s you can move on from there with confidence. The original confirmation of resistance occurred on the 6th, over the next 2 days several weaker signals appear. Longer term traders could use end of day or end of tomorrow expiry to catch these. Then late on the 8th a series of really nice signals start to show up. Notice how the pair make a nice bullish continuation pattern exactly across the 23.6% line. Remember, these lines are not going to be exact like this all the time but is uncanny how accurate they can be.