An effective way to use RSI trendlines!
Hi everybody,
In this article i want to share with you an effective way to use RSI trendlines to trade with the trend or a reversal. You already know from my previous articles that I use RSI to identify an overbought or an oversold condition. We will use again RSI for this job but now I am going to saw you how to draw simply and fast trendlines in RSI to have an extra confirmation and confidence for your online binary option trades.
Let’s go to the first screenshot. It’s from EUR/USD currency pair.
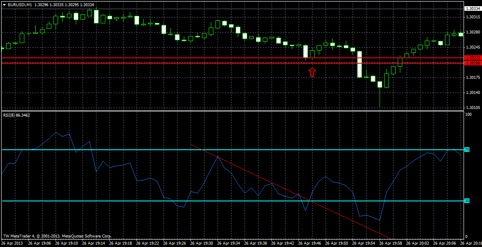
As you can see in this chart we don’t have many indicators, only our 8 period RSI for confirmation,it’s almost naked trading. Now, look at the screenshot.We have two red horizontal lines from previous supports which create a support area in this spot.When the price comes closer to this spot we should wait for a reversal.If you are a short-term trader the entry is very important, so many traders asking which is the right one. Should we wait for the price to hit the first red horizontal line?Maybe the second? We can use RSI trendlines for this reason. Look at the RSI. I drew a red trendline. As you can see the value in RSI makes lower- highs. We have a high in the beginning of the trendline, after that the value is moving down and makes a new high lower than the previous. The only thing we have to do is to connect the highs(high and lower-high) and our trendline is ready. Now, notice the behavior of the price and the behavior of the value in our 8 period RSI indicator.They agree so we don’t have a divergance. Notice that the value in RSI every time it hit the trendline makes bounces.The trendline acts as a resistance.Look at the call arrow in the screenshot. It’s the spot I took a call trade.The price hit a support level, as I said before and in this candle notice that the value in our RSI breaks the trendline. This is a reversal signal.
Let’s see more examples.
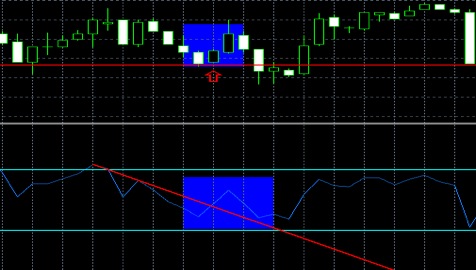
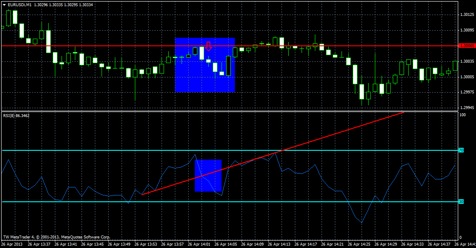
In the second screenshot we have again lower-highs of the value in our RSI and a support area in the chart, so we take a call. In the third screenhot we have the opposite condition. Look at the chart, we have a resistance in the red horizontal line and our RSI makes higher-lows, a sign that that the price is moving up now. When the price hit the resistance (the red horizontal line) notice the behavior of our indicator. The value breaks the trendline in the blue box. This is our confirmation and we take a put in this case.
You shouldn’t chase the trades, let them come to you. RSI is an indicator and just follow the price. You should be patient and wait for a clear break of the trendline. Maybe sometimes, you should wait to see how the first candle acts after the reversal and after that take your trade. Don’t forget overbought/oversold areas.
Best Regards,
Kostasze