2/2 ITM using Ichimoku & PA
Good Day Traders,
Two trades for me today.Both of them were in the money, both of themwere solid trades with solid setups. You know, there are some setups you are so sure about them and they give you risk free trades. Ichimoku Kinko Hyo many times can you give you setups like theese if you will read the market properly and follow the rules. Let’s take a look in my results and after that I am going to explain my trade and my setups.
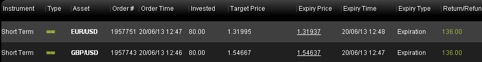
As you can see 2 ITM trades, both of them are 60 seconds trade.Let’s go to the first screen shot of the day.
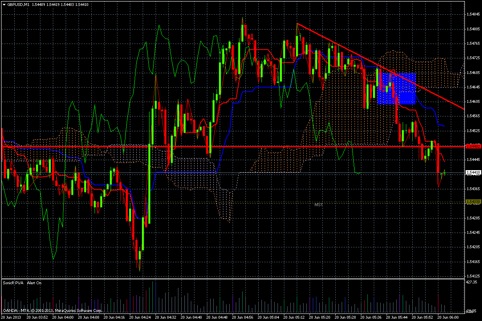
The first chart is from GBPUSD currency pair and I took a put in the blue rectangle. My trade is in the put arrow. So, I will expain this. I am using 1min timeframe and for indicators I have Ichimkou Kinko Hyo with the default setting and a Volume Spread Analysis indicator. I took this trade only by Ichimoku. I didn’t use the VSA indicator here.Firtst of all, let’s analyze the behavior of the price. It’s clear that we have lower highs and lower lows in the second part of this chart and there is a down trend. So, we should find put opportunities. I drew a red trend line which helps to see better the market condition.Now, look at the price. It’s moving down inside the Kumo. We have some tries of the price to move up but the trend line is acts as a resistance.In the blue box the trendline is in the same position with Kijun of Ichmoku and a little bid above the Tenkan of Ichi which are physical support and resistance level as I said in the article about Ichimoku. Furthemore when the price hit the Kijun and the trendline there is a pin bar. There is much confluence to take a put. Solid in the money trade.
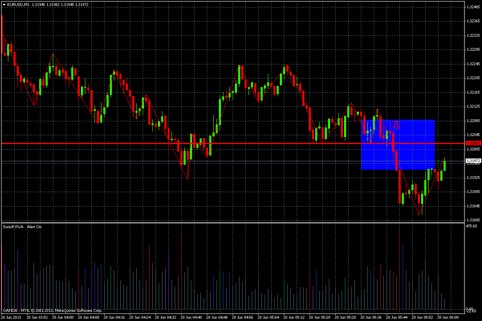
This is the second chart of the day from the EURUSD currency pair. I took a put inside the blue rectangle. My trade is in the put arrow. In this trade I used mainly pure price action and I had a little confirmation from the volume.Almost naked trading with out indicator. The red horizontal line is our support.Before the rectangle as you can see there are many bounces but notice that we have a lower high in the beginning of the rectangle.We should wait because there is a support near this spot.The price finally broke the support and I took a put. We can see from the volume that there is not heavily selling at bottoms, near the support(which is a buy signal) so I took an in the money Put.
Best Regards,
Kostasze