Using an ATR Trailing Stop Indicator for Spotting Trends and Reversals
The Average True Range Trailing Stop indicator is great for traders who need help spotting the trend, or need an indicator that can help them choose in which direction to place trades. The indicator also points out pullbacks that are strong enough to warn that the current trend may be in danger.
Average True Range (ATR)
Average True Range is a volatility measure which assigns a value based on the high of a price bar minus the low, or the high or low minus the previous close, whichever value is greater. This volatility is then averaged over a number of periods (price bars), such as 12 or 22 price bars.
The ATR is calculated as a price, so a reading of 0.5 means $0.50. It means that on average the price is moving about $0.50 each price bar. In forex the ATR will be measured in pips, so a reading of 21 means the price is moving about 21 pips, on average each, price bar.
ATR is a running calculation which means the indicator will continually produce new values based on new information. For more on ATR, see: Two Powerful Indicators and How I Use Them.
Average True Range Trailing Stop
Applying the ATR Trailing Stop to your chart creates a line which is either above or below the price.
When the indicator is above the price it signals the trend is down, and if the price moves above the line the trend may be in danger of reversing.
When the indicator is below the price it indicates the trend is up, and if the price moves below the line the trend may be in danger of reversing.
Figure 1 shows the ATR applied to a 3-minute chart of Apple (AAPL) stock.
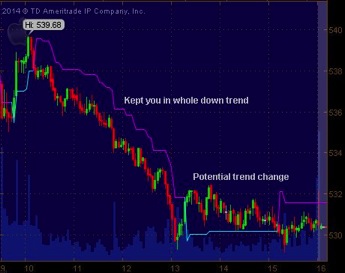
Once morning volatility subsided the price moved out of a brief uptrend and into an extended downtrend. When the downtrend began the indicator flipped on top of the price and stayed there throughout the entire decline.
This could have provided confirmation to traders that taking short position, or buying puts, was the ideal play.
Just after 13 (1:00), the price breaks above the ATR Trailing Stop, and sets in motion a potential uptrend. The price didn’t actually enter an uptrend, rather it moved sideways, yet the indicator would have warned traders that the downtrend was no longer in effect.
This is actually isn’t a trend-change indicator though. When the indicator “flips” all it means is that a larger than usual pullback has occurred. Sometimes, that means a trend change, other times not. Price analysis is also need to confirm trend changes. This indicator simply warns you that a larger than average pullback has occurred, and some caution is warranted.
Settings
The indicator in figure 1 is taking a 22-period moving average, and then multiplying it by 3. Therefore, behind the scenes, the indicator is calculating the current 22-period ATR, multiplying it by 3, and then adding it to the current price in the case of a downtrend, or subtracting it in the case of a downtrend. This is what creates the separation between the line and the current price.
Decreasing the settings will make it more sensitive to trend changes, but potentially false signals as well.
Increasing the settings will make the indicator less prone to false signals, but will be more delayed in spotting potential trend changes.
Pitfalls
The indicator works best in trending markets. When the price action is choppy, the indicator will flip-flop above and below the price, not providing a lot of useful data.
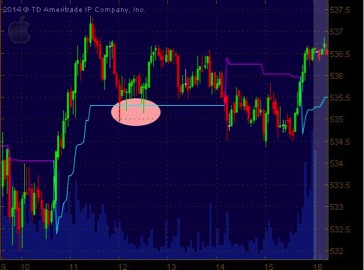
The indicator is based on the closing prices of bars. Therefore, ideally if using the indicator you will need to wait for price bars to close before acting on any information the indicator may provide. Figure 2 shows a choppier day in Apple stock. Notice in the oval how the price breaks below the ATR Trailing Stop line on several occasions, but since the bars don’t close below the line, the uptrend remains intact.
Another pitfall, which is not the indicator’s fault, is that it is not as common as some other indicators, and therefore may not be available on all charting sites or platforms.
Final Word
The ATR Trailing Stop indictor can help you trade in the direction of a trend. If it helps you, use it as a guide while you trade. For providing specific entry signals it isn’t ideal, rather it provides confirmation of the trend. When the indicator “flips” from uptrend to downtrend (or vice versa), use price analysis to determine if there is an actual trend change, if it was just a deep pullback or if the price is moving sideways.