Another Pivot Point Trade in Addition to Two Non-traditional Ones (3/3 ITM)
August 12, 2014
Tuesday was more EUR/USD trading once again. It’s definitely my favorite pair/asset to trade given how consistent it happens to be overall. Consistency is always a good thing in trading, as familiarity and proper habit setting can help breed success. The EUR/USD is always good for pretty solid price movement and overall volatility and is a great choice for the European and North American hours.
Trade #1
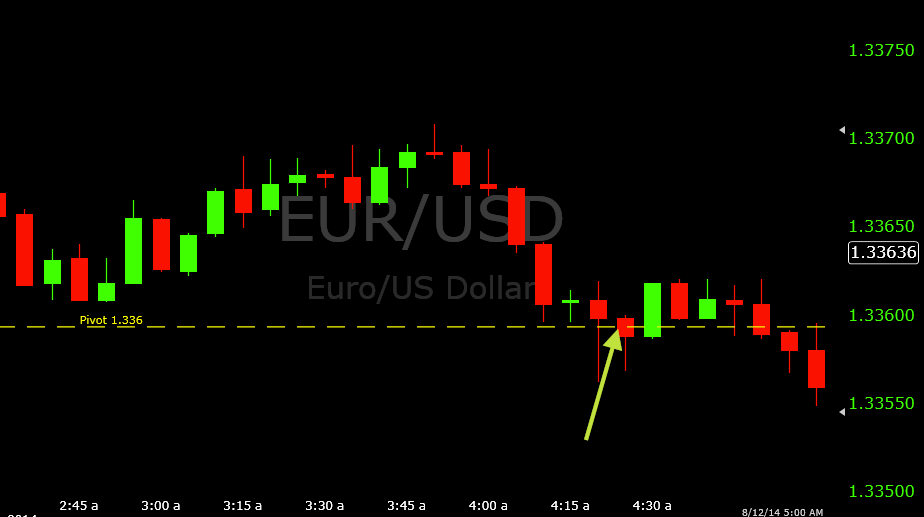
The pivot level of 1.33593 was in play past 4AM EST. The market had a pretty uneventful first couple hours. Normally, since I’m trading the European session, I try to begin viewing the market around 2AM EST just to see how things are at the open, observe any break in either direction and just to gauge where early opportunities might lie. The first couple hours were uneventful. There was a near challenge of pivot before 3AM, but it almost seemed like it would end up as a rather lazy trading day.
But the set-up on the first trade was pretty standard. And anyone who is familiar with my blog, writing, and style of trading will be able to immediately diagnose how things went just by looking at the image below the following paragraph.
Price touched pivot on the 4:20 candle and rejected the level. Trend wasn’t a factor here at all (that is, relative to the timeframe) so that gave me the confidence to get into a call option on a subsequent re-touch of that level. This occurred on the 4:25 candle. I went back and forth about whether to take a 4:30 expiry or a 4:45, but ultimately decided that a 4:30 expiry might be safer for the simple fact that it’s sooner. In the past I’ve heard the analogy that trading can be a lot like predicting the weather – easier to determine within close proximity but gets fuzzier the further out you try to predict. I think it holds true on some level. A bounce was produced here on the 4:25 candle and this trade won by 2-3 pips.
Trade #2
These next two trades were a bit unconventional relative to the ones that I usually take. Support 1, 1.33421, was the next target. But nothing set up there to my liking on the way down, and after the break of that level, nothing set up on the way back up with it acting as potential resistance.
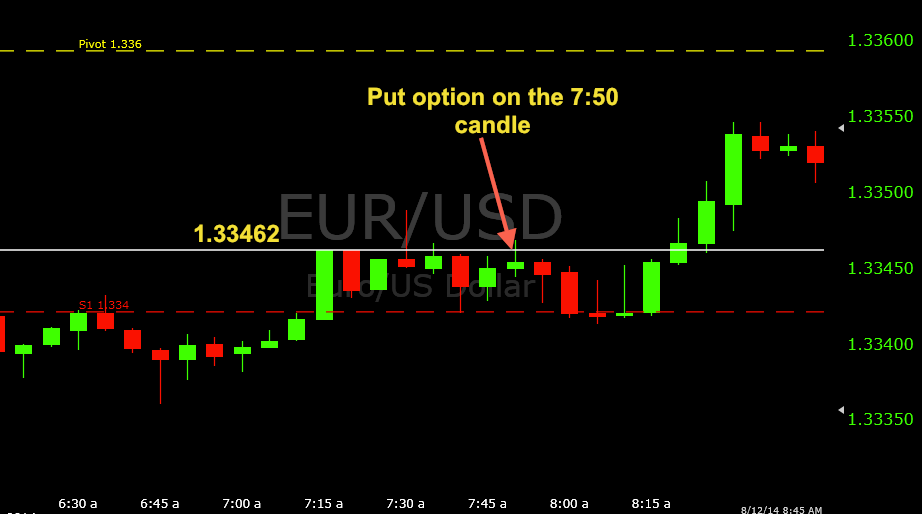
Not until 7:35AM EST did something actually come into view for me. On the way up from support 1, price kept running into a wall of resistance that had propped itself up along 1.33462. When the market reached back down to support 1 on the 7:40 candle, this told me that selling movement was still in force and realistic to expect for now. I never really like taking trades on the re-touch of a level if it follows a weak retracement. This tells me that the selling movement (in the case of a touch up to resistance) isn’t very strong and not likely to be sustained. And very often in such cases, resistance is broken.
But with the re-touch of support 1, I felt confident that another test of 1.33462 could lead to another selling bounce to fetch a winning trade out of it.
Price did return to 1.33462 two candles later on the 7:50, where I entered a put option on the touch of the level. I got exactly what I had hoped for and the trade closed out at around support 1 for about a four-pip winner.
Trade #3
My next trade nearly immediately followed the previous one. Given that my second trade closed around the support 1, it was realistic to start watching how price behaves around this particular marker. This level had been breached earlier, but there is always the possibility of it re-establishing itself.
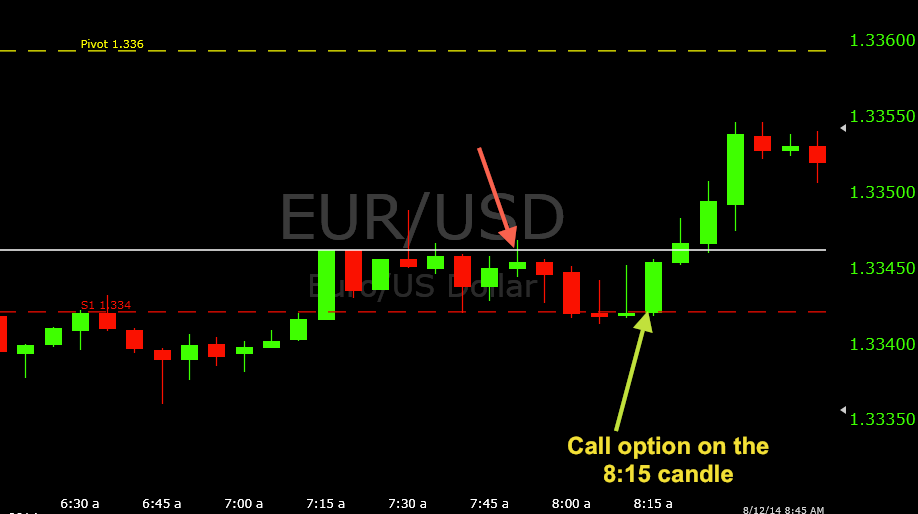
The 8:00 candle represented the closing candle of the previous trade. The 8:05 formed a doji (with an upper wick) at support 1. The 8:10 candle was basically a replica of the 8:05, but only with a longer upper wick. In textbooks, wicks are typically shown as something that shows rejective price action and helps dictate where a market might go next.
Typically you’re taught that an upper wick shows rejective movement toward the market going higher and suggests that a down-move might be in store. But upper wicks can also mean, and I believe are often more properly reflective of, that movement in the direction of the wick could genuinely be more likely. This is especially true in cases where the wick supersedes the length of the candle body itself, or if the wick is simply large in general relative to the magnitude of recent candlesticks. This is the entire concept of false breaks of a price level. It does not mean that a down-move will be more likely to occur. The fact that price broke the level in the first place is often indicative that it actually will do so completely on the next visit to that marker.
So in this market scenario, it seemed most probable to me that the upper wicks signaled buying movement was most likely. Consequently, I decided to take a trade during the opening seconds of the 8:15 candle around 1.33421.
This trade worked out way better than I ever expected and turned out to practically be a perfect decision. Price broke the 1.33462 level that was the basis of the previous trade. It could have conceivably worked as resistance and limited the potential of a call option, which I was aware of, but it did not. Overall, this trade won by about 12 pips.
Despite the fact that the trading day started in a rather non-descript fashion, I was still able to remain patient and gather three wins in as many chances. I know that it’s hard to wait for 2+ hours just for one trade to set up, and continuing to watch a market even if it’s very languid, but patience is a huge virtue in trading. Rather than taking mediocre set-ups out of boredom and inevitably suffering poor results because of it, it’s important to let the trades come to you before anything else.


