My 60 Seconds Binary Options Trading Style
Good Day Traders,
I’m Kostasze and my first article is about my trading style and some comments in my trades. First of all, I want to say that I am a short- term binary options trader, 1 min and 5 min expiry are both short-term trading.Personally, I prefer trading 1 min expiry with 1min chart.I sometimes use 5min chart to filter some of my entries.
Some benefits of 60secs trading:
- quick profit
- More trading opportunities
- More volatility when the market is slow
- Solid Price Action setups, at least for me
Downsides:
- Easy to miss an entry
- Losses can mount up quickly
- Can be addicitive due to risk of ‘gambling’ (Avoided with a strategy and discipline)
Best Brokers for 60 Second Trading Strategies
The Key:
Now, let’s go to the technical analysis. I believe that the most solid and the “holly grail”that many people are looking for(but they never understand it) is Price Action. I don’t mean candlesticks patterns, I am talking about how the price acts in some specific levels. These levels might been Support/Resistance,Daily Pivots as S/R, Fibos and extensions as S/R, Harmonic Patterns, Head & Shoulders, Double Top/Bottom Patterns, change of polarity(a support becomes a resistance and the opposite). This is what I call “PURE PRICE ACTION” and it’s something that you give you the opportunity to trade with or against the trend and stay profitable.
Indicators:
About the indicators, I have one simple thing to say. There isn’t a magic indicator, there isn’t a magic system which will make you rich. So, the best choice is to stop looking for them and learn basic price action. Personally, the indicators I use are EMA’s (for identifying the trend), CCI, RSI(for identifying overbought/oversold of the asset), whole number’s indicator(as confirmation of S/R), Daily Pivots and Daily Fibos indies. All of them are simple indicators to confirm PA and you can find them free.
Some Screenshots of my today trades using Price Action for trading a reversal
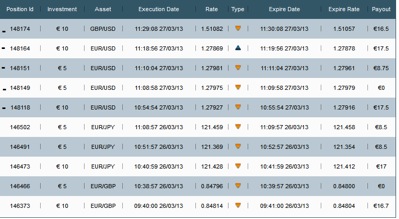
4/5 ITM
performance: 80%
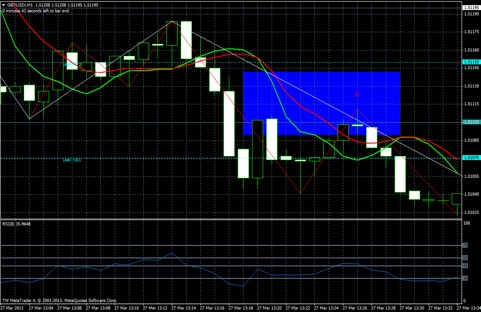
Look at the beginning of the rectangle. The price after a big movement upwards hit the whole number 1.51100(the cyan line) and then make a big movement down. The whole number is now our resistance. Price make a come back and come again near the whole number. When price touch our resistance I took the trade(the put arrow). It was ITM. The doji star here is our confirmation. You can easily see from the EMA’s (8 EMA is above 4 EMA) that we are in a down trend. So, in this case we are trading with the trend.
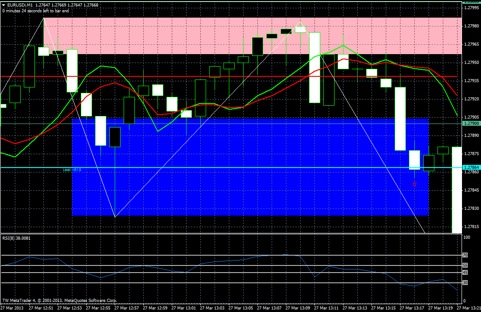
In the second screenshot we have the same situation but now we are taking a call the second time that price test th whole number 1.27864 which is our support. In this case you can see that our 8 period RSI is below 30 level. This means that the asset is oversold this moment and this is our confirmation. We should wait for a small pull pack and it comes.The next candle is green.ITM. Notice that we are in a down trend.
Kind Regards,
Kostasze