Why Use Historical Charts
Historical charts, or just charts, are the means by which we do what we do. Trade. Charts of historical price action are incredibly valuable and there is no question of there importance to technical analysis. However, there is widespread debate over the importance of using historical data to back test and its reliability on future results. Well, I’m here to tell you that it is important and it is a reliable means of predicting future results. Seriously, if you doubt it then why are you even considering using technical analysis? Technical analysis is nothing but charts, past price action and its bearing on future price movements. One of the pillars of TA is that the market always repeats itself and those repetitions are measurable and predictable. As for back testing goes, hindsight is 20/20 as the saying goes. It’s easy to look back on a chart and see where a signal formed just so, leading to profits.
An Invaluable Educational And Trading Tool
Historical charts are important for a number of reasons. First and foremost is education. You have to learn in order to be good and using past examples is a well recognized method of teaching. It’s one thing to read about rising and declining triangles, support and resistance, pin bars, retracements, cross overs and oversold levels but it is something else to see it, on a chart, and to see how price action behaved before and after. Think about naturalists for example. There are millions of varieties of insects on the planet. In order to recognize and differentiate the myriad variety of ants from each other and other ant-like insects scientists study examples in the laboratory. For us as traders our lab is the charts. We go to the lab, examine known examples of past price patterns in order to become familiar with them and hone our skills and then we look for those patterns as they begin to appear in order to make trades. The more familiar you are with past price patterns the better you will be at recognizing them as they happen.
The second reason, and equally important, is that historical data has great bearing on current price action. Past highs and lows are often key areas of support and/or resistance that provide targets for entries. These highs and or lows represent areas where past buyers are either able to recoup losses or to get into new trades at ideal prices. They can be areas that attract new buyers or prove to current bears that the market is indeed truly weak. At the same time past price action can also be indicative of direction and duration of a move. A break out from a bull flag has an easily predictable target level, important for binary traders because that is a crucial factor in determining expiry. I have found over the ten plus years I have been trading that a line drawn on my charts never ceases to be valid. If I draw it and prices come back to it tomorrow, next week, next year or many years down the line it will affect price action.
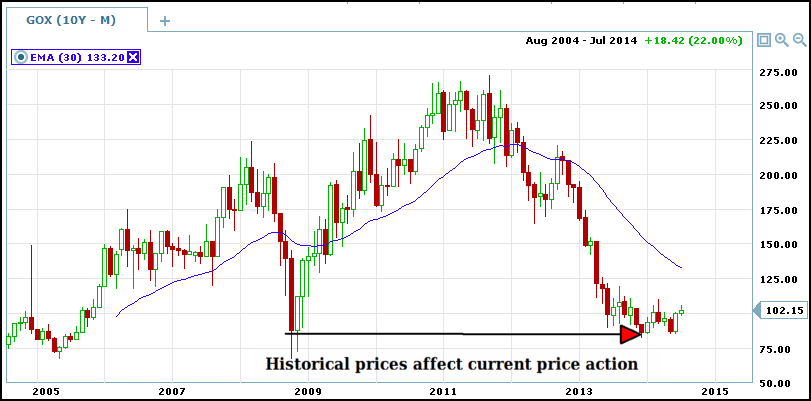
Look at the chart above of the CBOE Gold Index. This is a ten year chart of monthly candlesticks, a very long term chart indeed. It is easy to see that the lows of 2008 are acting as a support level for the index at the current time, 5 years later. This support level has a strong implication than a shorter term level of support or resistance and could adversely affect a trade if not accounted for. This same theory applies down through all the time frames. A trader could use this chart and then drill down to one of weekly prices in order to more closely watch support and then use charts of daily and hourly prices to pinpoint trades based on bounces and breaks of the long term support line. I have also used Fibonacci Retracements on this chart as a means of predicting other areas of support and resistance, all based on past price action. In the end, all recognizable past price movements can have an impact on current price action.
The Hard Right Edge
The part of the chart where new price action happens be it weekly, daily, hourly or shorter is often referred to as the “hard right edge”. This is because, obviously, it is the right side of the chart but also because this is where the hard decisions have to be made. Whether or not to buy, sell or hold. Making a trading decision can be very hard, so hard in fact that it keeps many from ever pulling the trigger. This is why using the historical charts, knowing the historical charts and using past price action is so important. It will help you learn what to look for, boost your confidence level so you know what to expect when you see what you have learned begin to unfold and pave the way to a life of successful trading. Knowing exactly what prices will do once you reach the hard right edge is impossible to do but you can still trade with confidence knowing that you will be right more times than you are wrong.