Trading High Probability Consolidations
March 17 offered a number of consolidations in the EURUSD during the US session. Certain types of consolidations provide ideal trade candidates, as risk can be kept very small and the relative reward can be huge (trading traditional markets). If trading binary options these consolidations can still provide great trade opportunities, but you’ll need to flip through some historical charts to determine how long the high probability consolidations last so you choose an appropriate expiry. Here’s the basic setup we are looking for…as well as some examples of what we aren’t looking for.
High Probability Consolidations
First off, “high probability” is somewhat subjective, since we are looking for consolidations that have a general appearance, and it will take some practice to spot them.
In Trading the Mini-Channel Breakout I discussed a very tight pullback or consolidation, where the price typically moves in a very small channel against the trend. Today, we look at another slight variation of that.
After a nice trend it is common to see the price “drift” either sideways or slightly against the trend. It may not exactly be a channel, but there is little directional movement, the price is wiggling back and forth within a small area (relative to trend) and most importantly price isn’t showing any aggressive movement against the trend to indicate the trend is over. When this occurs, we have a great setup.
The oval in Figure 1 marks this type this of consolidation. The trend is up, and then the price begins to drift sideways. In hindsight, I can circle the whole consolidation, but in real-time you wouldn’t be able to tell the price is moving sideways until several waves have formed and the price is no longer moving to the downside.
Figure 1. High Probability Consolidation – EURUSD 1 Minute Chart
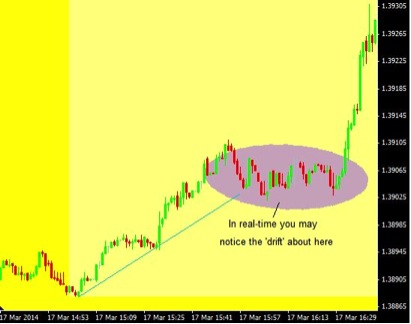
The majority of the consolidation is less than the half the size of the last thrust higher; if the consolidations becomes bigger than this then the probability of the consolidation declines because it may be a topping or bottoming (during a downtrend) pattern.
High Probability of What?
A consolidation is a pause in a trend, therefore, in figure 1 we want to buy during that consolidation because we can anticipate that the trend will continue following the completion of the consolidation.
It does not work all the time, and it does take practice to spot high probability consolidations, but more often than not when I spot these consolidations the trend resumes after.
Trading
A “classic” approach to consolidations is to wait for a breakout. In Figure 1 that would mean buying near the top of the oval or even slightly higher.
When we have a consolidation that looks like this I know that more often than not the trend will continue. Therefore, I do not wait for a breakout. I try to buy near the lows of the consolidation (for an uptrend like in Figure 1) and then just hold it until an upside breakout actually occurs. I place a stop a bit below the consolidation.
If the price ends up breakout lower, since I bought near the low of the consolidation (in an uptrend) and my stop loss is nearby, my risk is extremely small. On the other hand, if the price breaks higher, which often it will, I have one of the best prices and can maximize my profit.
Figure 2. Entry and Stop
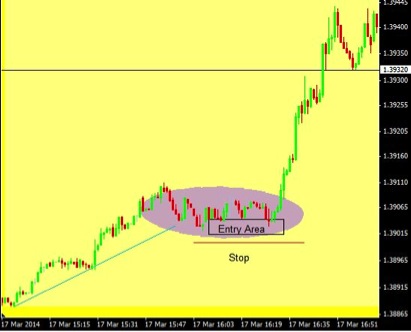
In figure 1 I marked the point where in “real-time” we could anticipate that this was a tradable consolidation. After that point we could put out an entry in the lower portion (in uptrend) of the consolidation. A stop is placed a bit outside the consolidation.
If the trend is down, we look for a similar looking consolidation, but we will enter a short position (buy puts) near the top of the consolidation, expecting the price to trend lower once the consolidation is over.
If using a profit target, Fibonacci Extensions can help approximate where to take profit.
What We Aren’t Looking For
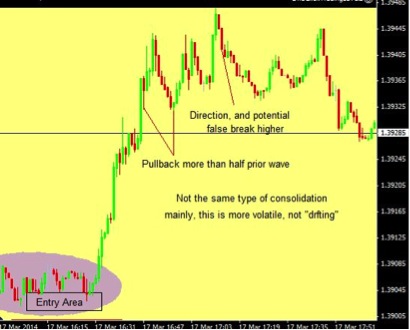
Later in the US session, on March 17, we see another consolidation. Yet this is not the same as the prior consolidation. So while I would trade Figure 2 as shown, I would not trade the consolidation shown in figure 3 the same way. The chart explains several reasons why, although mainly the pattern is more volatile–it isn’t “drifting” and that means it is harder to control risk and could quite possibly be a reversal pattern instead of a consolidation where we are expecting the trend to continue.
Figure 3. Don’t Trade This Type of Pattern the Same Way – EURUSD 1 Minute Chart
Final Word
When there is a nice trend and then the price begins to drift sideways, or even slightly against the trend, I get aggressive. Once I realize the price is consolidating, I want to get in near the low of the consolidation during an uptrend, or near the high of the consolidation during a downtrend. This keeps my risk very small and my potential profit large. It takes practice to spot these types of consolidations though. Utilize it in a demo account, spotting the patterns, entering and exiting/choosing expiries. Until consistently profitable with method don’t trade it with real capital.