Chart Patterns, Magnitude, Price Targets And Expiry
Trading binary options is all about technical analysis and technical analysis is all about chart patterns. Chart patterns are what we look for as technicians, they are what we measure and how we make our predictions. There are a few ways to look at patterns but today I want to stick to basic price patterns, how to use them to pick targets and why you should care about that as a binary options trader. Basically, there are three types of price patterns available to us; continuation patterns, consolidation and reversal patterns. Each of these patterns are unique but the basic rules for targeting apply to all three. Why targets? We’re not trading spot or equity options so there is no need to have an exit strategy. All you need to know is which direction to take the trade right? Wrong. You also need to choose the right expiry and that is where targets come into play. Not only that, you want to increase your success rate and the number of signals you get right?
What Is A Chart Pattern?
A chart pattern is any identifiable, measurable and predictable pattern of price movement that appears on the chart of a traded asset. For this discussion I will be using Japanese Candlesticks on my chart but this is not about Candlestick Patterns. This is about price movement and price pattern. As mentioned above price movement can make three basic patterns; continuation, consolidation and reversal. These can appear in any time frame and can be near, short or long term in implication. The good news is that the basic rules for targeting apply the same across the board. Take for example the bullish triangle as shown below. This is a chart pattern with a different signal implication than say a Head & Shoulders, Trading Range or Double Top. In order to predict where any of these may go you simply measure the magnitude of the pattern. This could be the distance of the move leading up to the pattern or the height of the pattern itself. For the H&S this might be the distance, in $, from the top of the pattern to the bottom. For the Triangle/Flag it could be the length of the Flag Pole from the start of the rally to the base of the pattern itself or the height of the Triangle from the base to its highest point. On a break out of the pattern the target would then be equal to the magnitude of the pattern that led up to it.
-
Magnitude – The height and/or distance of a chart pattern. This can be measured in price or time or both. This can be measured from the bottom to the top of an identified pattern such as a H&S or Trading Range or from the start to the finish of a movement preceding a pattern such as a Flag or Triangle. Once you have established the magnitude of a movement you can then use that number to predict price targets.
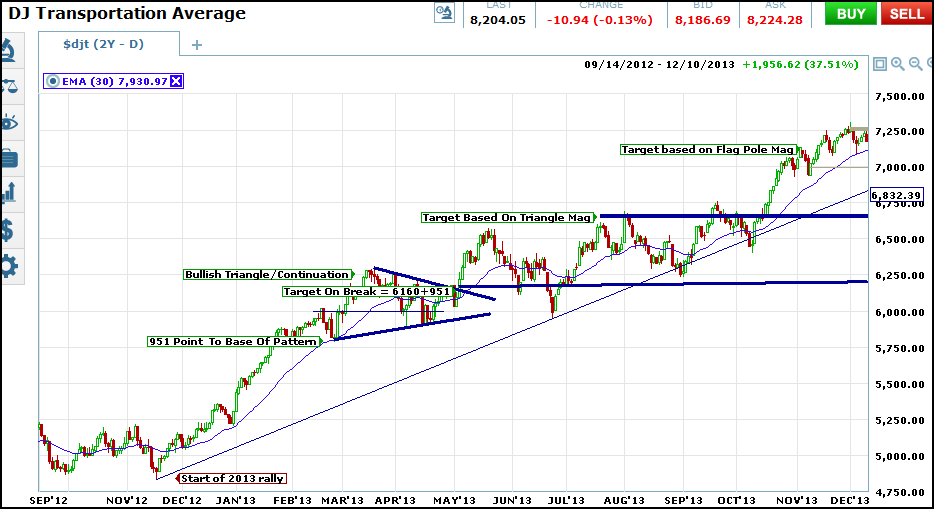
Looking at the chart above you can see where I have marked the beginning of a rally, the base of a triangle pattern and then some targets predicted from the magnitude of the movement. The first, and longest term target, is the one predicted from the rally leading up to the triangle. The rally lasts 4 months from start to peak, the triangle lasts for 2 so we can assume that any target predicted from the flag pole will be roughly twice as long in duration as one derived from the triangle itself. This same principal can be seen in the magnitudes of the moves. The flag pole is roughly 951 points from it’s start to the base of the triangle. The triangle is roughly 509 points from base to peak; about half the length of the rally. Extending this out we can see that targets derived from both numbers turned out to be important areas of price action.
Take note that once the triangle was broken targets derived from both the flag pole and the triangle were reached. The shorter term signal, the one derived from the triangle, were met in the first three months following the break. The second and longer term signal was met roughly 6 months after the break out, or twice as long.
Targets, Entries And Expiry
Once you have a time and price target you can easily apply those to your expiry. Remember, this method can be applied to any time frame and can be very helpful in choosing expiry. In my example I am using charts of daily prices so my expiry’s of choice will be weekly and monthly. On a confirmed break I can enter one position with an expected time horizon of my first and shorter term target and one with my longer term target. Once that is done I can then move down to a shorter term time frame, say one hour, and safely begin taking entries in the direction of my target, until that target is met. Along the way I will always be looking for additional patterns to help pinpoint the smaller movements within the larger movement. Take for example the Trading Range that formed following the initial break of the Triangle Pattern. The magnitude of this pattern is roughly 500 points, or half the expected the long term target.