3 Binary Options Trading Strategies For Beginners
This article was originally contributed by the archived community member Mikko. We no longer maintain contact details for the original author. The content has been fact-checked and updated for accuracy by our editorial team.
Note! If you are new to binary options and different strategies please go to our strategy page where we cover the topic comprehensively!
If you’ve studied and understood my previous posts about the fundamentals of binary option FX trading and binary options indicators, you are now ready to trade for real. Here are 3 different strategies that I use, choose one based on your risk appetite. Good luck!
Conservative Long-term Strategy
This strategy is for those who are new to this game and want to build up their capital slow and steady. The point of this strategy is to minimize risk and wait for the perfect setup on the chart.
In this case the perfect setup is using the ZigZag’s last 2 points, and draw a Fibonacci between them in the direction of the trend.
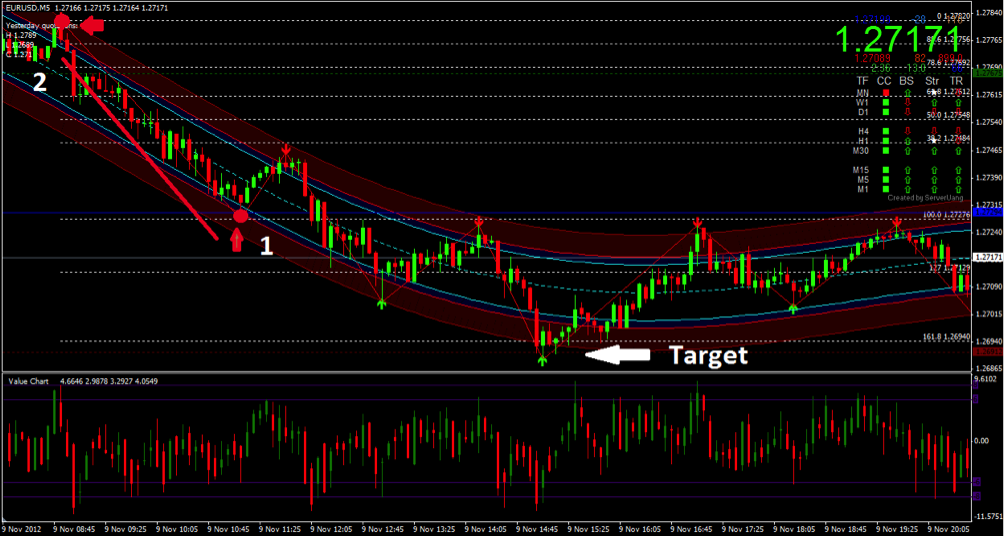
Draw your fibo from point 1 to point 2 for a down trend, and vice versa for an uptrend. Your target is 161.8 projection level.
In order for the signal to be fully valid, there has to be a retracement to between 50 – 88.6. Higher the retracement goes, stronger the signal. In the example above, the retracement happens next to the number 2 in the up left corner.
They key here is to be patient until all 3 factors line up.
The entry rule is:
– Price hits Fibonacci projection level 161.8.
– Price is inside or outside of the bounds of the red channel.
– Value Chart hits level 8 or above
Your Expiry can be between 5 and 20 minutes. And your target is 1-2 trades per day.
And money management suggestion for this strategy is to take 2 equal bids per day for 20 days. Increase your position by 50% next day. If you lose, start with the last set of bids:
Day 1: 10 + 10
Day 2: 15 + 15
Day 3: 21 + 21… and so on. You should reach around 5k in profits within 20 days, and next month just start over or carry on from where you left.
Top Brokers for Beginners
| Broker | Min Deposit | Expiry Times | ||
|---|---|---|---|---|
 |
Capitalcore | $10 | 1 minute - 1 hour | » Visit |
 |
IQCent | $250 | 5 seconds - 1 month | » Visit |
 |
RaceOption | $200 | 5 seconds - 30 days | » Visit |
Visit
Semi-Conservative Strategy
The semi conservative strategy involves 4-6 trades per day. The rules are the same as for the conservative strategy, only with one exception: We take the trade at Fibonacci projection level 127 as well as 161.8.
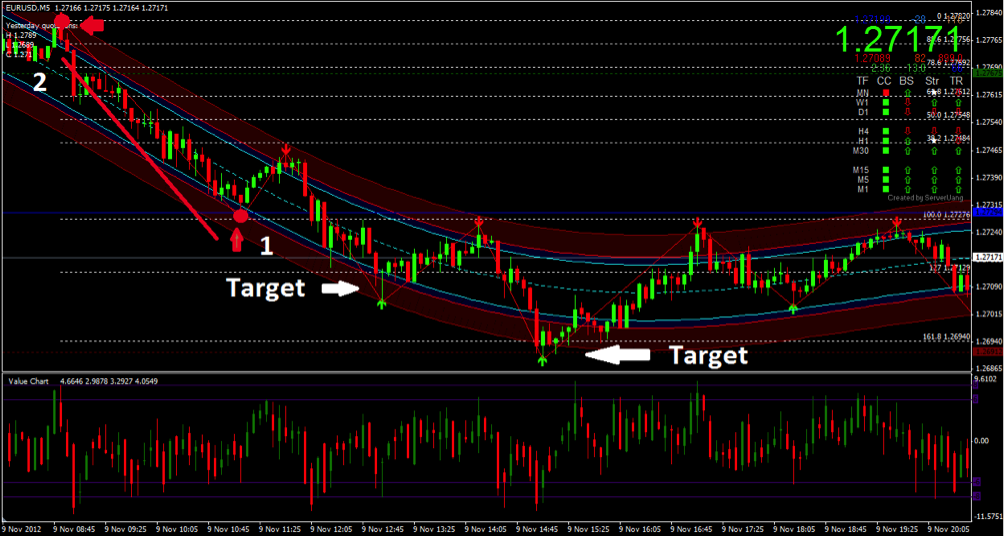
Now, for level 127 trades, I would advise not to take the trade with more than 6 minutes to the expiry. This is because usually level 127 represents a consolidation level to draw buyers/sellers into the trend to get more liquidity and the price usually carries on in the direction of the trend within the next 3 candles.
The rules for entry are the same as with the conservative strategy:
– Value Chart hits level 8
– Price is inside the red zone
– Price hits the Fibonacci 127 projection level
Use the same money management as with conservative strategy, but your earnings will increase faster.
And remember, You have to stick with the entry rules.
Now, the below strategy is a very aggressive one that defines the means of sane trading. This strategy represents the use of price cycles and Fibonacci sequence in fast trading. Trades are not only taken at levels 127 and 161.8, but also at breakouts. And Fibonacci levels are drawn for every cycle. This strategy also exploit the full potential of value charts.
Above you learnt what you are hunting, where to find your prey, and how to bag some prey steady and safe. Now, we will go after the BIG 5.
Aggressive Strategy
Look at the chart below, how many price cycles do you see?
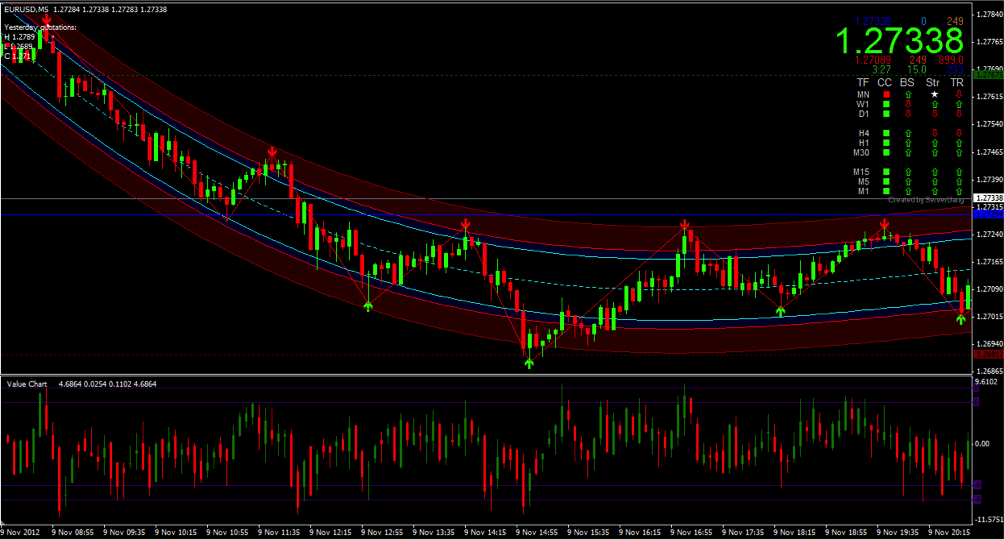
Yes, 9 cycles. Now, change your zigzag indicator parameters to 2,1,1. How many short-term price cycles do you see now?
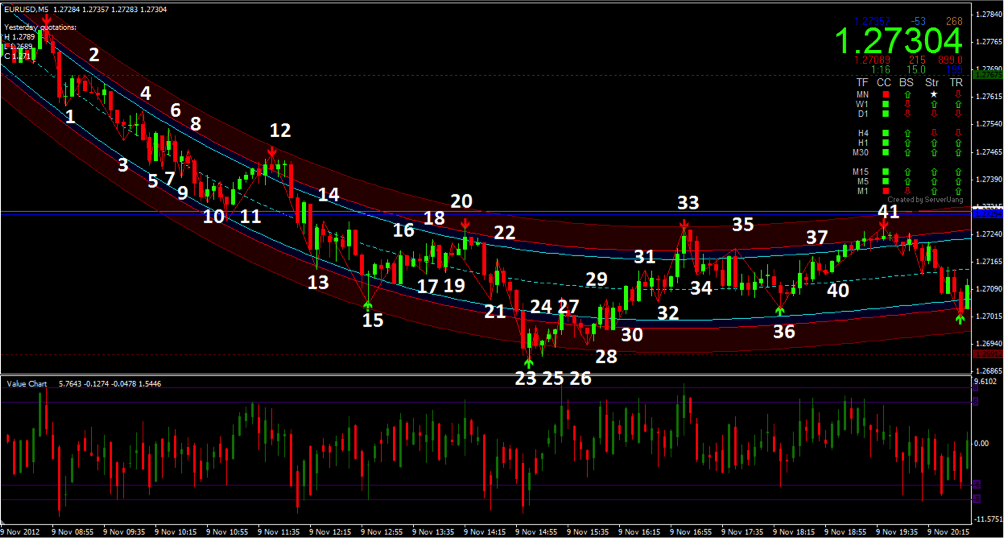
Yup, 41+ short-term price cycles. In reality there are many many more, but let’s not make it too difficult. Each of these cycles is a Fibonacci sequence with a high-low-retracement-projection-reverse. Look at the chart below:
Now it gets complicated and wonderful:
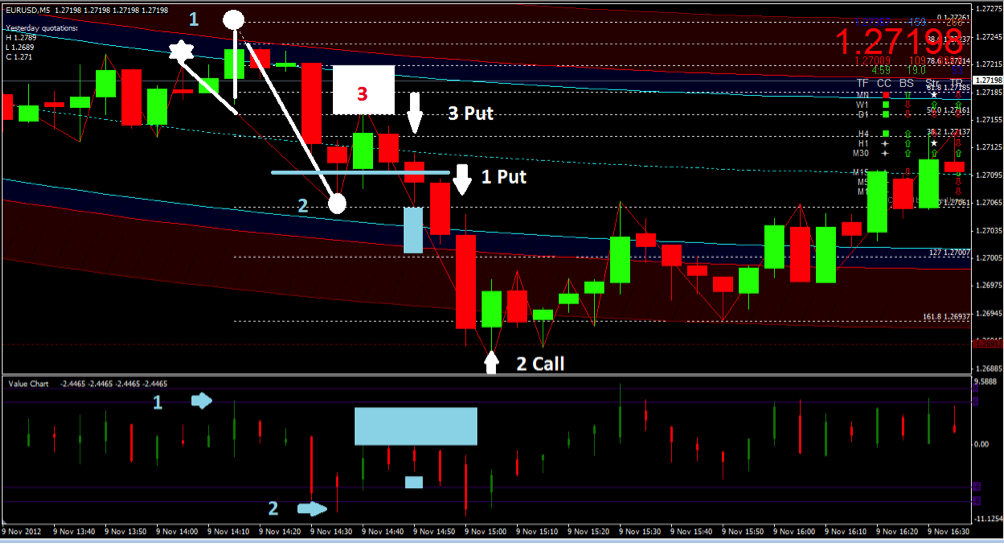
- The Fibonacci is drawn between points 1 and 2 (in light blue)and marked on value charts the last high and low, 1 and 2 respectively. Now we have the levels and wait for the retracement which can be a wick, or a full candle. Above the retracement area is the white box marked by 3, and the green candle underneath touches that box.
- The setup is ready when the retracement candle is followed by a red candle in the direction of the trend. Now wake up.
- The next red candle closes below the open of the green retracement candle, BUT it doesn’t touch value chart level 6 yet, nor the regression channels inner band. This is marked by the light blue rectangle. So this is our first breakout candle of this specific sequence. We enter PUT 10 seconds before the close of this candle, as the next candle WILL BE BEARISH, with 90% probability. This is marked by 3 PUT on the chart above.
- The next candle closes below our 100 Fibonacci level but DOES NOT TOUCH LEVEL 127, which means it closed below the low of our current sequence. We enter PUT 10 seconds before the close of this candle because it will be followed by a bearish candle, or 2-3 bearish candles which will reach level Fibonacci level 161.8. This trade is represented on the chart by 1 PUT.
- The last bearish candle hits Fibonacci level 161.8 and value chart level -8 and also the outline of the red zone, so we place a CALL.
Within each price cycle between 3 points there are on average 3 ITM trade setups during normal volatility trading conditions. And for this strategy it goes without saying that if you don’t ‘feel’ the trade or something about the setup doesn’t seem right, don’t take it and wait for the next one.
This strategy will produce around 100 setups per currency pair per day, so use it wisely, and be very sure to learn it by heart before you jump in full steam.
The 3 strategies explained here work for all currency pairs, commodities, stocks and indices. However, even with the conservative strategy, a trader can produce excellent results if they trade 5-6 assets, and take 2 high probability trades per asset per day.
As usual leave comment below if you have any questions. Happy Trading!
Click here to read my next and last post in this mini series
Further reading: