Two Early Morning Trades
January 12, 2013
These are two trades that I took in the early morning on November 28, 2012. (My previous post, dated December 30, 2012, explained a trade I took the afternoon of that same day.)
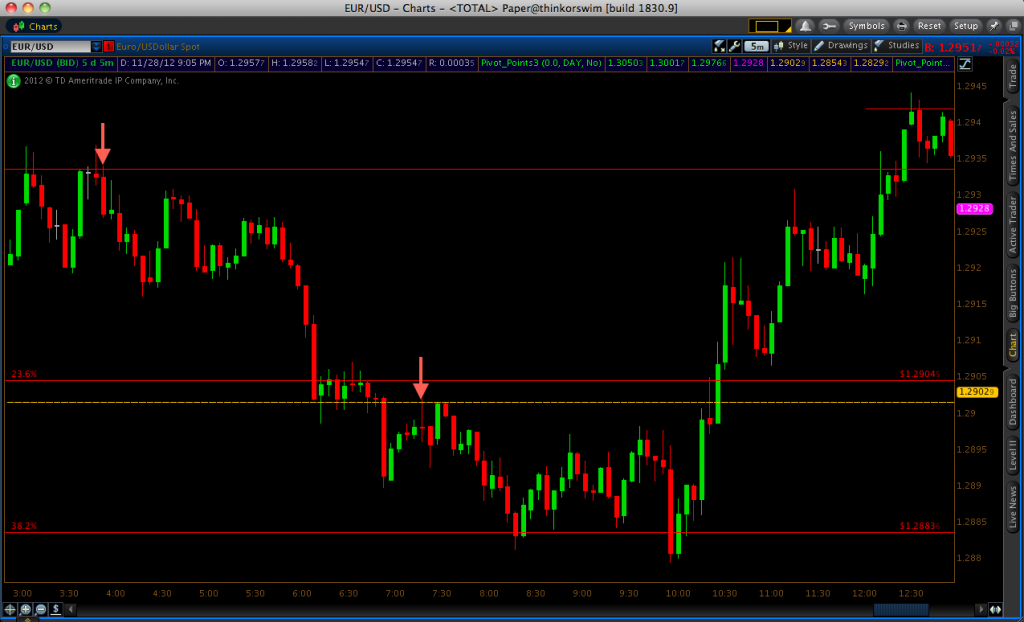
My first trade occurred at 3:50AM EST and is denoted by the red arrow, showing that I took a put option. I based my trade on the 1.2934 price level when I saw price holding pretty well between 3:10-3:15AM and again between 3:30-3:45. The price action showed consecutive dojis, which demonstrate rejection of price moving beyond a certain point. To me, this indicated that we were at a “supply zone,” where the buying activity doesn’t overcome the selling and a resistance level forms. On the 3:50 candle, I decided that there was a good chance that price would continue to hold at 1.2934 so I took a put option. By the 4:00 expiry, I had about a six-pip winner.
After that, price never did get back up to the 1.2934 resistance level that morning. The retracement that began around 4:30 was weak so I figured it would most likely be a day where the Euro would depreciate against the U.S. dollar. At the very least, I figured it would come down to hit one of the daily pivot lines located at 1.29029. I did not, however, choose to take a call option trade once it hit that level.
Daily pivot points are good tools that can be used for those who trade on shorter timeframes – e.g., binary options traders and forex scalpers – as a way of finding areas where price is likely to reverse. However, we had been in an overall downtrend for the morning, so I decided not to take a trade against the trend. Moreover, a 23.6% Fibonacci retracement level was only a matter of three pips or so above the pivot line. I don’t take trades into areas of close resistance (usually what I define as ten pips or less for 5-20 minute expiries). As seen on the chart above, prive hovered between the pivot line and 23.6% Fibonacci line for about forty minutes, before continuing it’s downtrend. That was expected. Price was clearly reluctant to go back up, so a strong break of the pivot level is the most logical outcome after a period of such tight ranging activity.
Now you could be thinking, if I felt that this currency pair would be most likely to go down, why hadn’t I taken advantage of this by taking any put option trades? The truth is that I’ve never had much success with taking random entries with the trend. I’ve always needed to base my trades on some sort of support or resistance level. Even when I’ve been correct in guessing the general short-term trend and have made trades based on this sentiment, I’ve lost quite a few of them because of the small retracements that come in the context of a downtrend. I decided that my next trade, if I were to eventually take another, would potentially come on another put option if price retraced back up to the 1.29029 pivot level.
My second put option for the morning came on the 7:20 candle when 1.29029 eventually resurfaced. The main factors supporting this trade were that the trend had been down and price had shown sensitivity to the 1.29029 level only about a half-hour earlier. Therefore, it had a pretty high probability of working out. The trade actually turned out to be a very marginal winner (less than one pip), but fortunately it still won nonetheless.
And that was it for the morning. Just two trades nearly four hours apart. Patience is essential. So much money is lost simply because traders want to make money quickly and believe that trading more is essential to boosting the account balance. Always ensure that you trade only the best set-ups and with small investment sizes to ward off the negative effects emotion can have on one’s trading performance.