The Importance Of Your Entries
Today Trades: The importance of your entries
Hey Traders,
Kostasze is here. Today, I want to share with you my trades and make some comments on them about the importance of their entries. As I said in a previous article, entries is the most important thing of your trades.Everone may have a good and solid strategy but false or early entries can destroy his account.I am going to give you some tips. Here are my today trades.
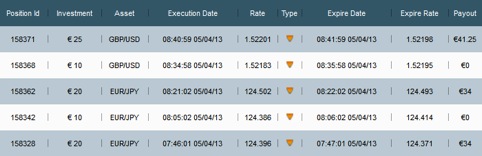
3/5 ITM. It’s not my best performance because of an early entry in EUR/JPY. It could be 4/5, a respectable performance but it’s not. Let’s see why. Here is the first screenshot.
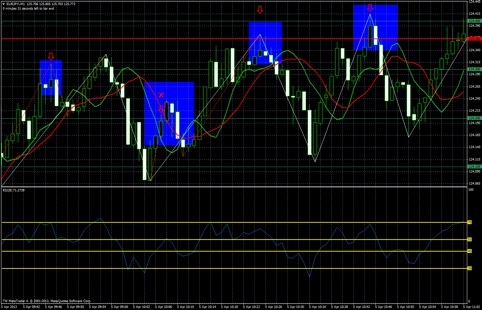
I took my trades in the first three blue boxes. The 4th box is an ITM trade but I didn’t take it because I wasn’t in front of the monitor. In the first blue box you can see that we have a whole number (the cyan line).The first time the price hit the whole number with a long green candle we have a rejection.Notice the long wick of the candle.The candle hit this level and we have a rejection in the same minute.This is our resistance.The second time the price hit this level I took a put.Our RSI was overbought.The trade was ITM.
Now, look at the second blue box. Here is my OTM trade because of the early entry.We have again a whole number.The price hit this level and we have a small rejection.So, I took a put.OTM. Where is my fault? I will tell you where it is.Look at the beginning of the screenshot.Near the same whole number we have a resistance but not in the whole number , near it.A little bit above it. Three minutes later the price broke this resistance. This means that the price has the strength to break again this level(my entry).Furthermore, the 8 period RSI wasn’t in overbought condition in my entry.Another signal.After one minute, when price hit the real resistance a little bit above the whole number we have a pull back. This is the right entry and it’s ITM.
3rd blue box.The red horizontal line is a strong past resistance.I was waiting for the price to hit this level and I took a put.ITM.
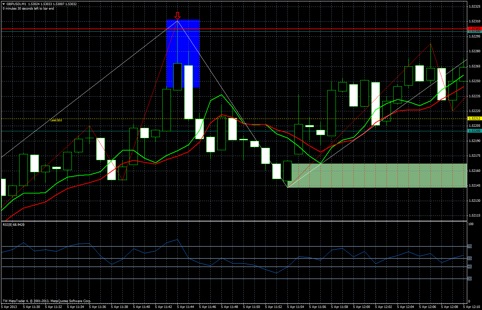
Here is the second screenshot.In the blue box you can see the trade I took.Notice the red horizontal line.It’s a strong past resistance of the day and a whole number,too.Our 8 period RSI is extremely overbought(hit almost level 80).In this case we have so many clues which give us a clear signal for our trade.I took a put when price hit this level.We had a rejection in the same minute and after that the price was moving down for about 10 minutes.ITM. You should always look for the price behaviour in the past.You should always notice the rejections, the strength of the price and you should always “feel the market” before every trade. Don’t trade mechanically.
Kind Regards,
Kostasze