Ripple Scores Another Win, XRP Price Drops Furiously
Bitcoin Turns Into a Loaded Spring. BB Squeeze in Play.
Ripple Labs scored a new victory in their legal case versus the SEC but despite this, XRP’s price dropped as low as $0.4225 after previously trading at $0.4650. The Hinman documents – as they are widely known – have finally landed in Ripple counsel’s laps.
Stuart Alderoty (general counsel at Ripple) had this to say on Twitter: “Over 18 months and 6 court orders later, we finally have the Hinman docs (internal SEC emails and drafts of his infamous 2018 speech).” However, the documents remain confidential, as per the SEC’s request but they were “well worth the fight”. Ripple’s counsel Alderoty on Twitter: “While they remain confidential for now (at the SEC’s insistence), I can say that it was well worth the fight to get them”.
On previous occasions, Ripple’s success in the legal battle with the SEC was met with strong bullish responses on the chart. However, this time, things are a bit different. XRP dropped from yesterday’s high at 0.4650 to a low at 0.4225 and is trading at 0.4425 at the time of writing. Many other altcoins have dropped as well, so we could say that XRP’s downshift is just a case of correlation with the altcoin market and maybe the Ripple vs. SEC case is not playing such a big role this time.
Meantime, Bitcoin is showing resilience and is trading in a tight range, albeit with a bearish bias. However, the apex coin has not experienced the major weakness that’s present in the rest of the crypto market. The Bollinger Bands are tightly squeezed together (aka a BB Squeeze), which is a sign that a strong move will occur in the near future.
Chart Analysis – XRP/USD
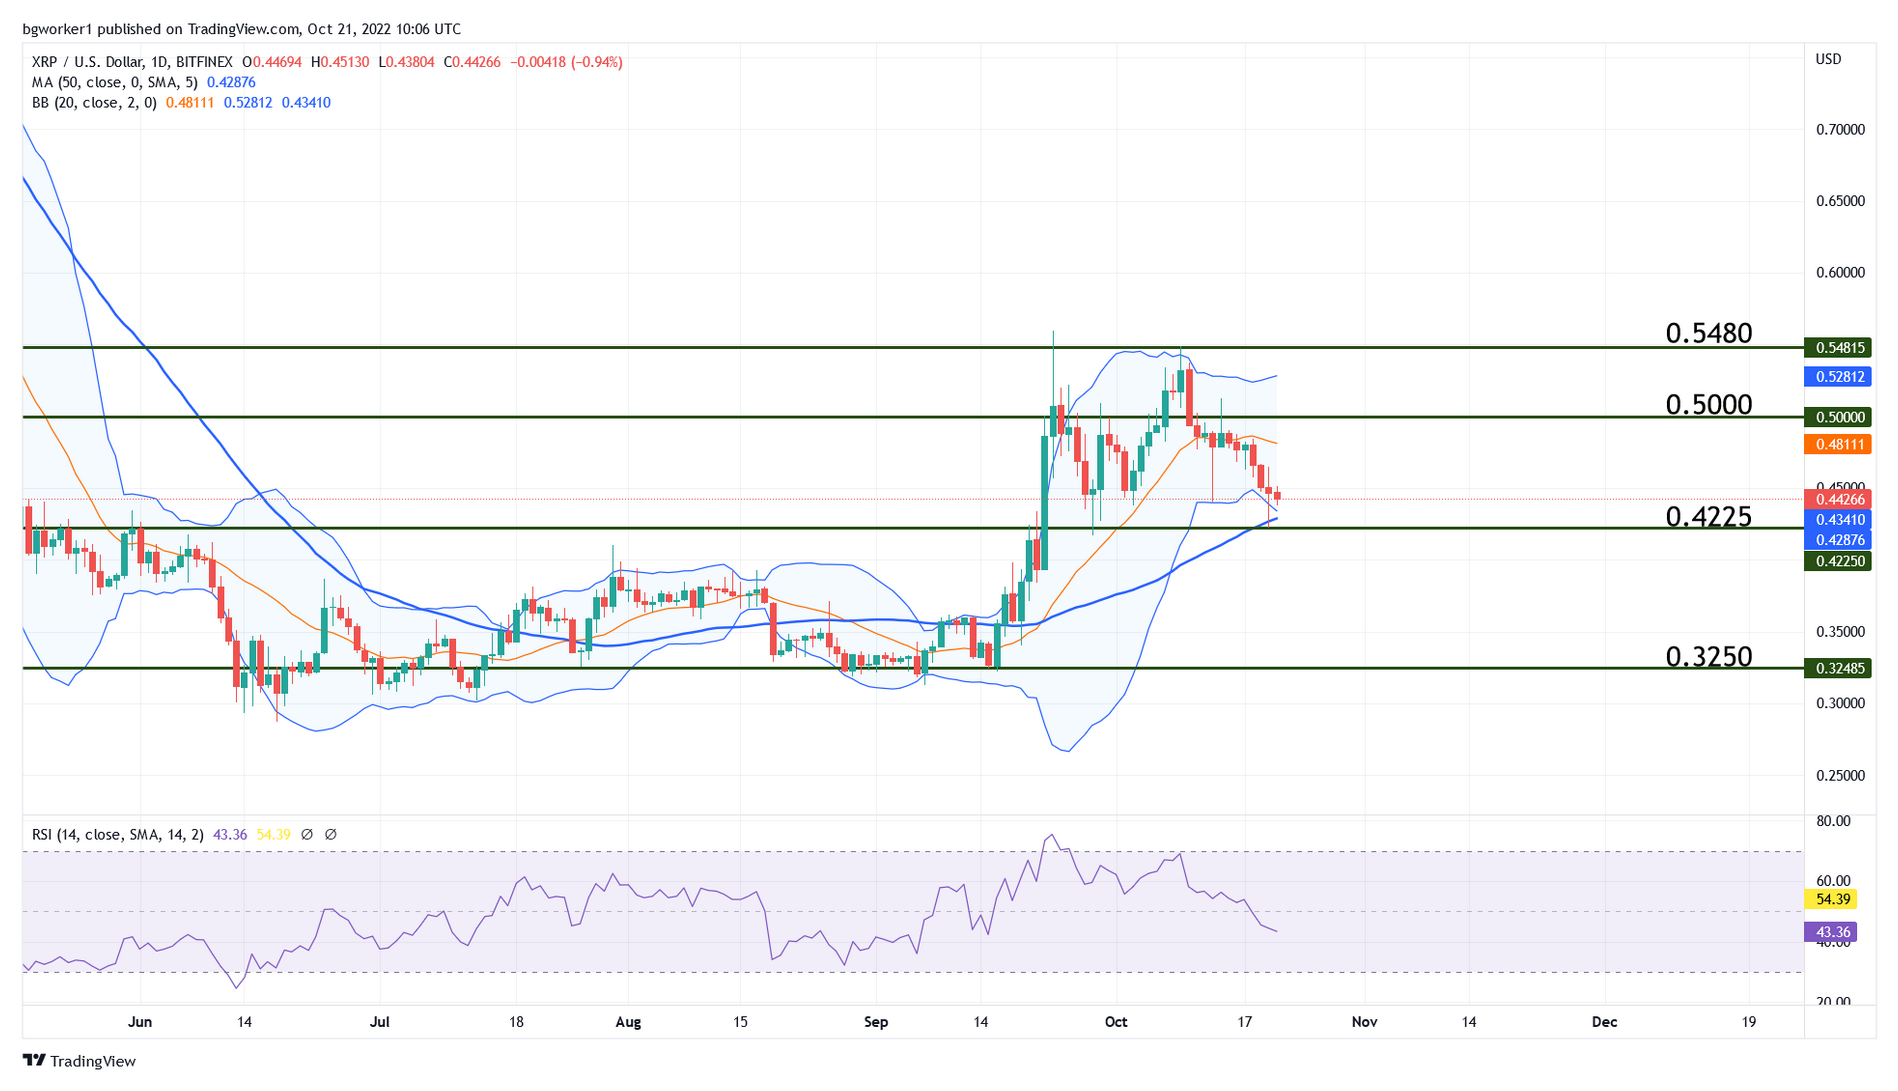
After the strong climb seen in late September, the pair failed to print a new high and stopped short of a double top, which is a bearish pattern. This price action has established 0.5480 – 0.5500 as a strong resistance zone.
The bearish movement that started at the top of the Bollinger Bands has met support at the 50-day Moving Average (blue line) and the lower Bollinger Band. Horizontal support now sits at 0.4225. If the price starts to bounce around this area, it will confirm that support is holding, which means that the pair will start to move up.
A break of the mentioned area will result in a stronger bearish move, especially considering that the RSI is not oversold and has just crossed its 50 line, which usually means that a downtrend emerges.