Is Ripple Heading Lower? Looks Like It
The Ripple Chart Does Not Look Good
I was just doing my daily perusal of the crypto market when I stumbled across an interesting headline. It said Ripple had just scored a major investment and the XRP coin was up 5% because of it. I immediately went to the chart and you know what I found? Not a coin up 5% that’s for sure, and not one that looks anything close to be bullish.
Ripple, The News
Ripple, a California-based cryptocurrency startup, announced it had raised $200 million in a round of Series C funding. The money comes from global investment firm Tetragon among others and is intended to help Ripple as it scales. Ripple’s CEO says the funding proves institutional investors see the utility and value of Ripple. Whether or not that is true in a broad-sense is yet to be seen.
Brad Garlinghouse, CEO of Ripple, said this…
“We are in a strong financial position to execute against our vision. As others in the blockchain space have slowed their growth or even shut down, we have accelerated our momentum and industry leadership throughout 2019.”
In the blog post, Ripple revealed that its client-base was growing at an exponential rate. Much of the funding will be used to expand the worldwide team. The outlook for 2020 is robust, the company is expecting another 30-40% in customer growth, so the move seems like a good one.
Ripple, The Technical Analysis
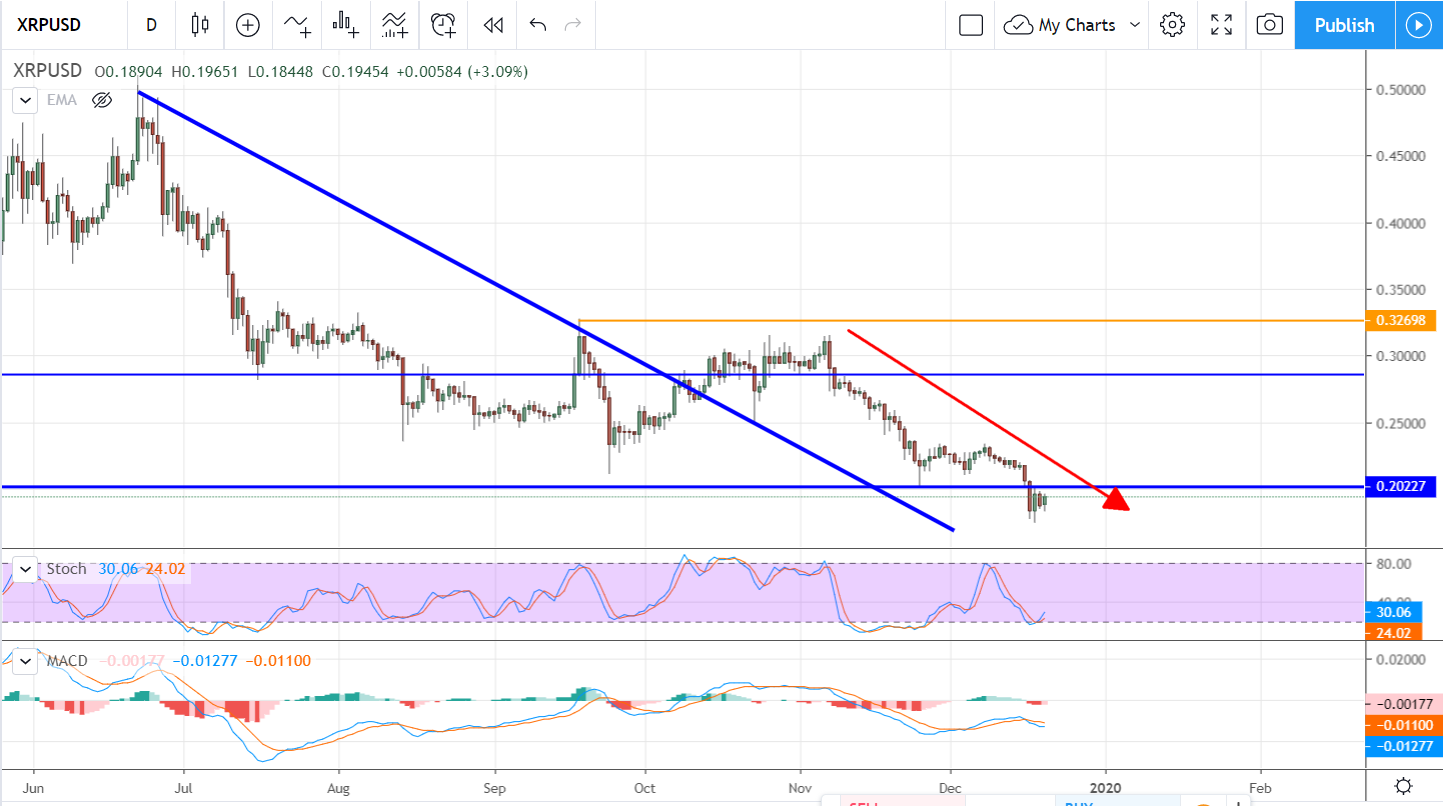
With Ripple doing so well I expected to see this chart ripping higher. Holding steady at least, not what I found, not a downtrend. Yes, XRP surged 5% on the news but that’s not much for crypto. A look at the charts shows the move barely made it to the top of a near-term trading range. What I find alarming, at least in the bullish sense, is that XRP/USD is in a downtrend. The failed break-out last June resulted in a sharp drop in prices, the drop in prices has fallen below support, and now the price action looks like it is setting up for another move lower.
Price action over the past is bearish and worse, it looks like a bearish flag pattern. The flag pattern is a continuation signal that, if confirmed, will take prices down to $0.16 real fast. The risk is that the stochastic is showing a bullish crossover but let me say this: within a downtrend such a set up is a better time to sell than buy. In either case, I’d wait for a confirming signal before trading. In the bearish sense, a move to new lows would be the signal. In the bullish sense, a move to new highs (above the top of the near-term range), could be a signal but I’d be wary. Resistance at the $0.20 level could be very strong.