Is Another Bitcoin Crash On The Way?
Bitcoin on the Ropes, Ominous Signs Point Towards More Selling
By Bogdan Giulvezan
The flagship cryptocurrency is trading below $50K key support, with a medium-term bearish bias and with the potential to sink even lower. On December 4, Bitcoin suffered a flash crash, dropping slightly below $42,000 but has since recovered some of the losses, currently trading at $47,700.
The sudden drop was attributed mostly to the liquidation of leveraged long positions, which triggered panic selling. When a Buy position hits Stop Loss or is liquidated by the exchange due to a margin call, it is closed via a Sell. When talking about leveraged trading, a small movement against the trader’s position can result in a big loss and the closing of said position. As opposed to that, if the trader owns the coin, he or she can withstand larger price drops because the position will never be closed unless the trader decides so.
Nowadays a lot of crypto exchanges allow leveraged trading, which obviously has its appeal (a small movement in the direction predicted by the trader can result in big gains) but as soon as Buys get closed (via Stop Loss or liquidation sells), price drops and this prompts non-leveraged traders to sell as well. This takes the price even lower and results in panic selling, which basically happened on December 4.
The bloodshed may not be over, as on-chain data shows that Bitcoin exchange inflows are growing. This is a sign that Bitcoin whales are moving their BTC to exchanges, possibly to sell for fiat or to convert to altcoins. Of course, it is not confirmed that everyone who sends BTC to exchanges is going to sell, but this possible dumping is bearish for Bitcoin and could trigger more downside.
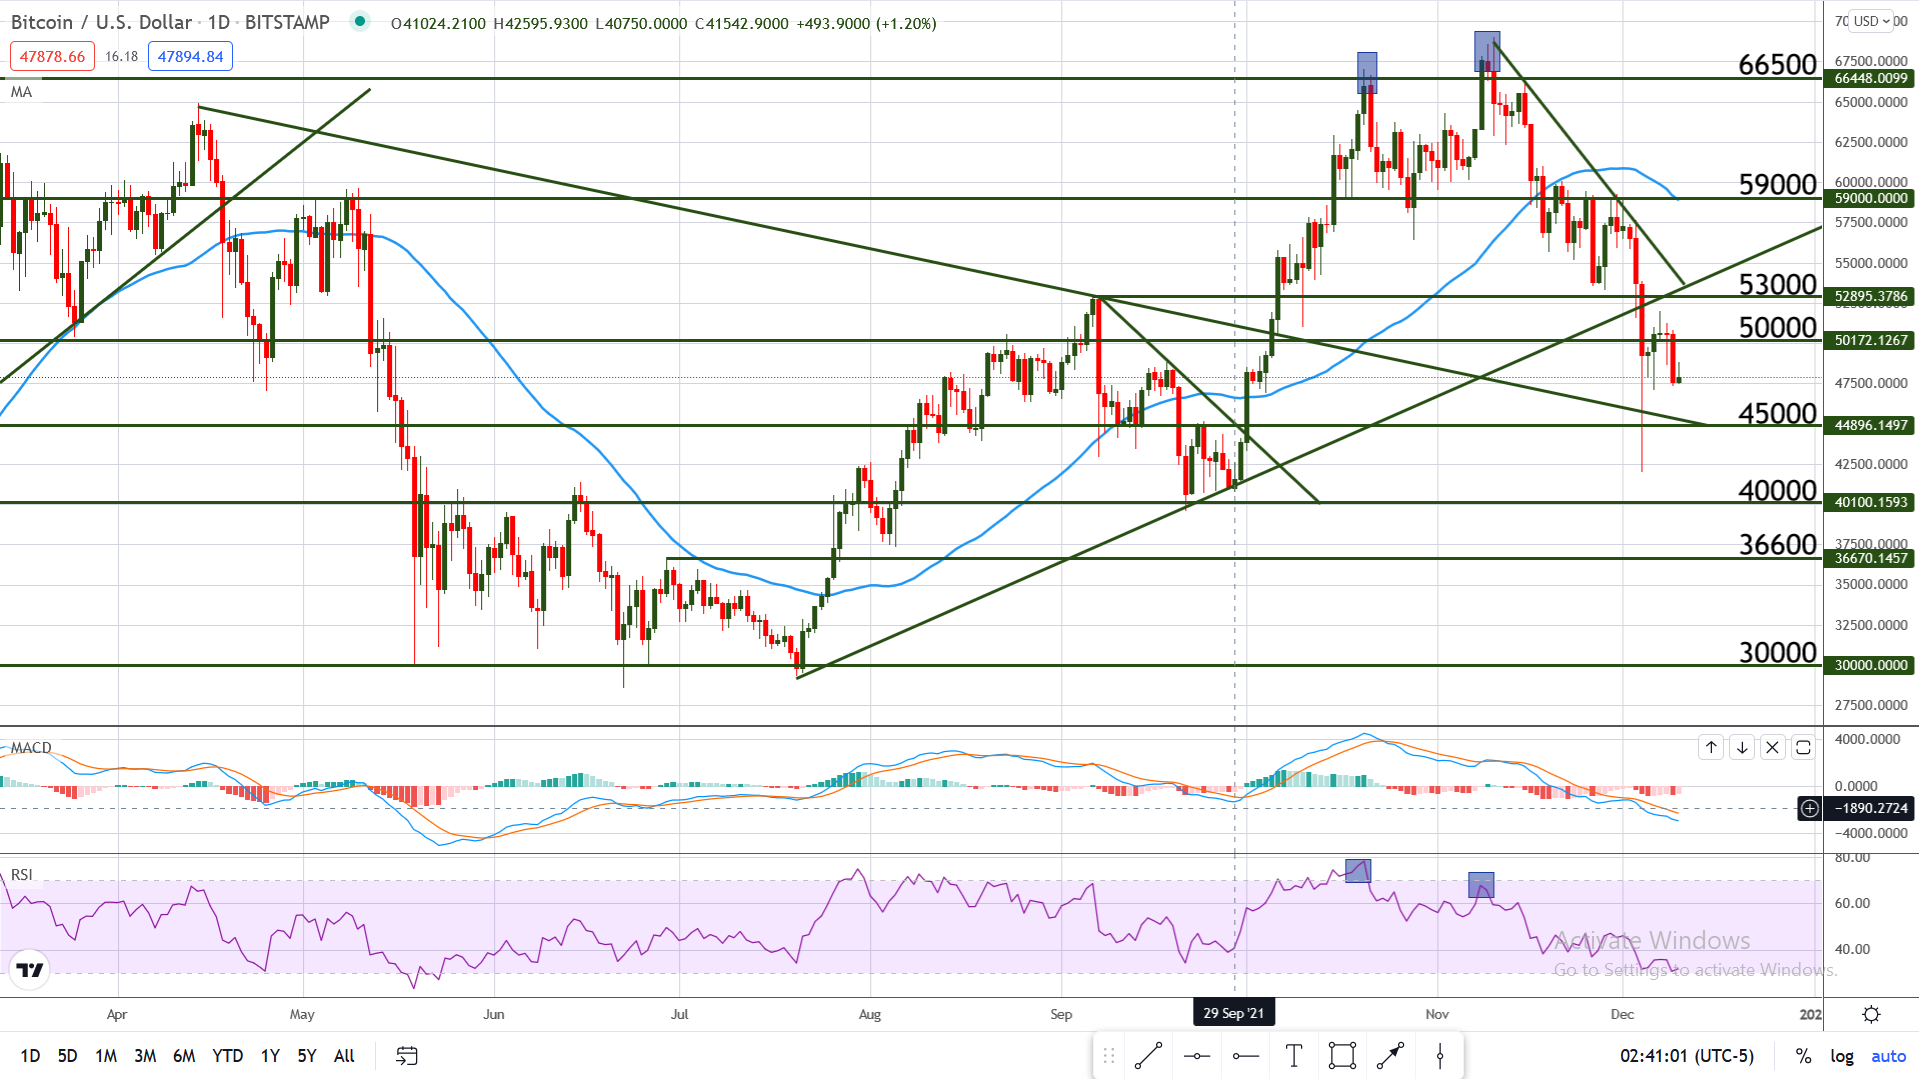
Chart Analysis – BTC/USD
Bitcoin is down more than 15% over the last 7 business days and the bears are in almost complete control of the pair. Price dropped through several support zones and is now approaching a long-term bearish trend line that forms a confluence zone with $45,000 support.
Confluence forms where two or more technical elements meet or come in very close vicinity. The closest confluence zone is at $45,000 and the way price behaves here will be an important clue for future movement. If the bears manage to break the strong support represented by the confluence zone, this is a sign that downside momentum is building up and that we may be in for a longer period of bearish price action.
A bounce at the confluence may prompt investors, whales, and retail traders alike to assume that the dip is over and to start buying due to the appeal of a low price (compared to $69,000 just a month ago).
A move above $50,000 would be a victory for the bulls but a move above $53,000 and above the long-term bullish trend line would be an even more impressive feat, considering that we are dealing with a confluence zone that acts as resistance in that area.