Fed Pivot Becomes Imminent. How Will It Affect Crypto?
Bitcoin Continues the Grind. Where Are the Bulls?
Earlier in the week, major cryptocurrencies and altcoins surged as the FOMC minutes revealed that the pace of rate increases is about to slow down. The document revealed that “slowing in the pace of increase would likely soon be appropriate”.
As soon as risk assets caught wind of this ‘slowing down’ talk, they started to rally, lifted by expectations that talk will become fact in the near future. Thus far, the Fed’s tight monetary policy has been dealing blow after blow to Bitcoin’s price, which has lost more than 75% of its all-time high ($69,000).
Considering the signals that the Fed is putting out, it’s very likely that we will see a 50-bps increase at the next meeting, which is scheduled for December. The market will be affected by speculation until the actual decision comes out and the old adage “buy the rumor, sell the news” will likely come into play. We may see some rallies in risk assets but a trend reversal will have to be fuelled by a lot more than just talk of slowing down.
According to a tweet from on-chain analysis firm Santiment, Ethereum whales are “accumulating at the most significant rate in two years” despite the price of ETH being a quarter of what it was a year back. In the same tweet, Santiment mentioned that “In Oct/Nov 2020, these 100 to 100k [ETH] addresses assisted in pushing [ETH] to a +50% price rise over 5 weeks,”
It will be interesting to see how this accumulation will affect the price going forward and whether it will spill onto Ethereum’s bigger brother, Bitcoin. The pieces seem to fall into place for a stronger climb (Fed slowing down, whales accumulating) but support looks flimsy and the bears seem to have a good grip on the situation.
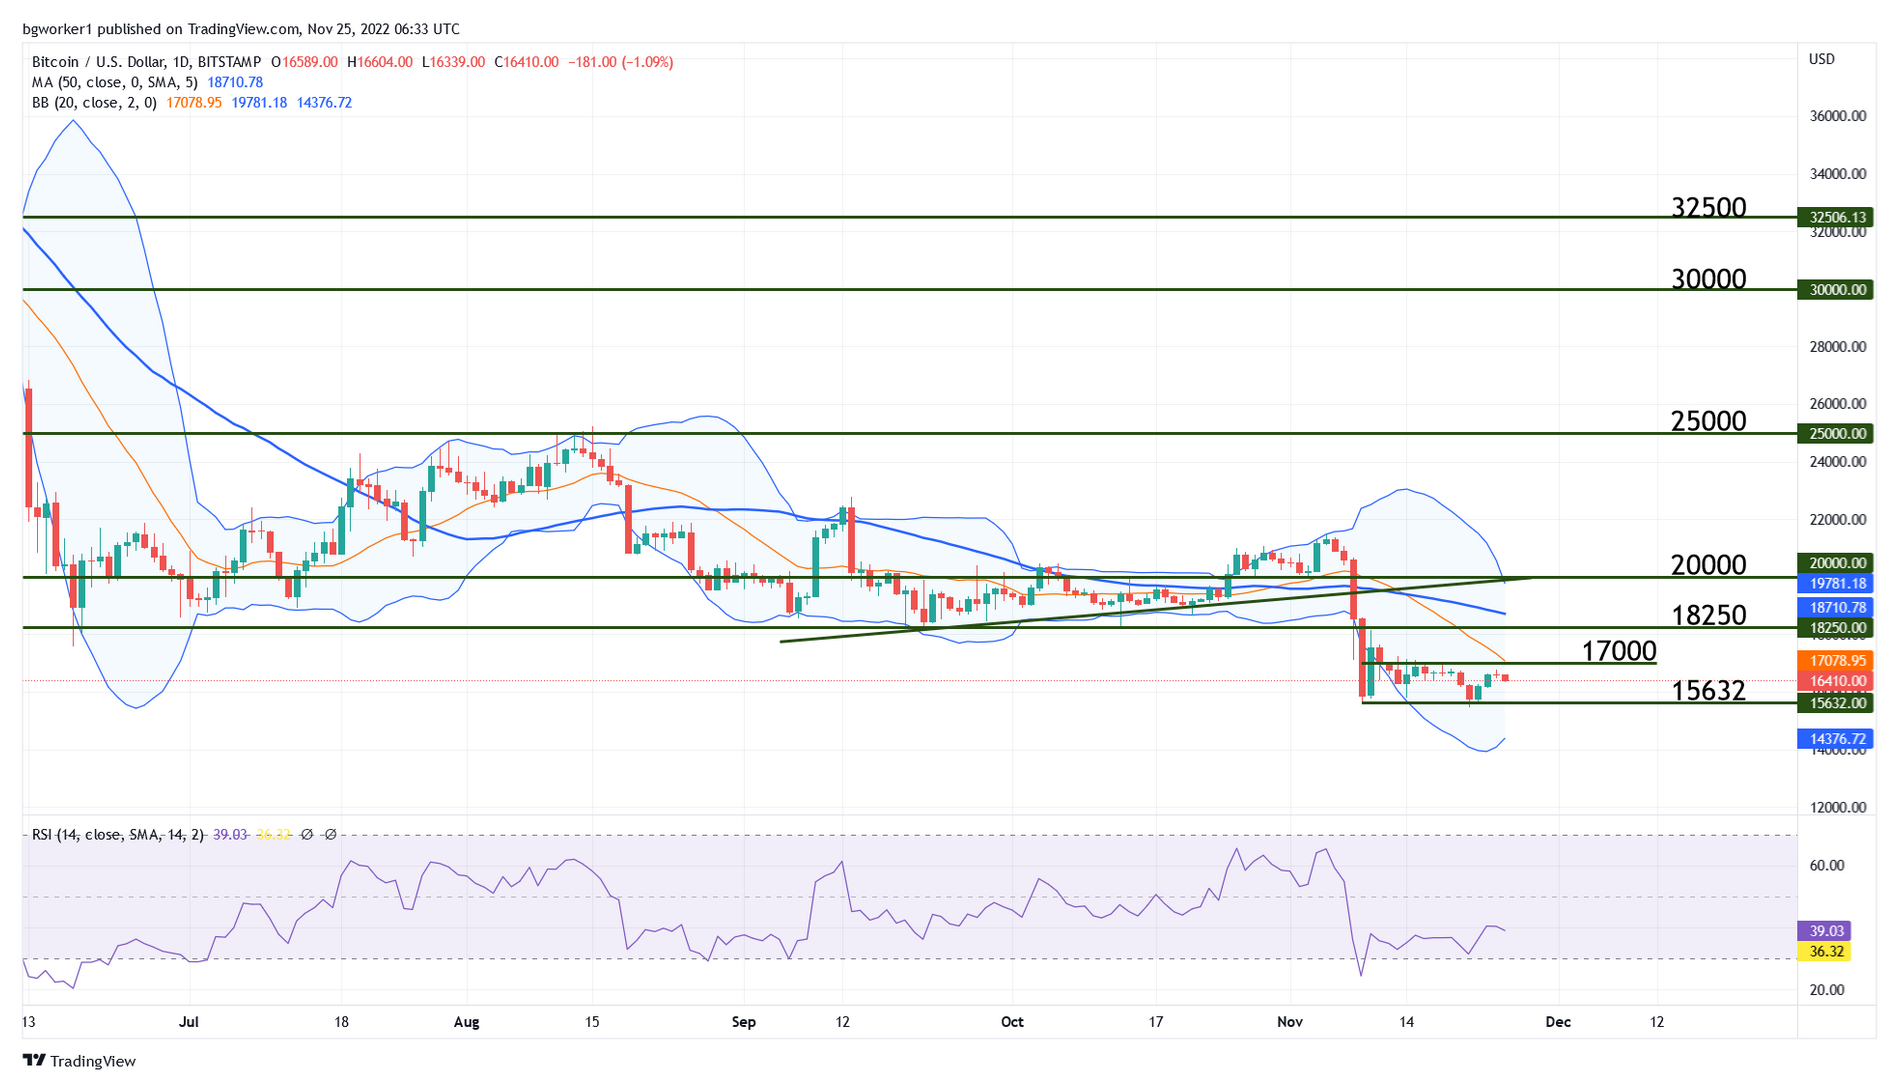
Technical Outlook – BTC/USD
After the last strong drop, the price started to move sideways and bounced twice around $15,632. This level is now support but the bearish pressure is high, and so are the chances of a break of this level.
Resistance is located between $16,700 and $17,000, which also coincides with the middle line of the Bollinger Bands. If the bulls manage to surpass this confluence zone, the chances of a stronger rally will increase.
The RSI became oversold during the 8 – 9 November drop and now it is showing bullish divergence: price made a double bottom at support but the indicator made a higher low. The overall bias is bearish and thus we will probably see another encounter with the latest support.