End-of-Year Rally: Will History Repeat Itself?
Is Bitcoin Poised For Another Rally?
by Bogdan Giulvezan
Bitcoin is certainly a volatility monster and this was perfectly shown during 2020 when the digital gold traded below $4,000 in March only to finish the year above $29,000. Almost 50% of all these gains came in the last two weeks of December. And yes, we are now in the last 2 weeks of December.
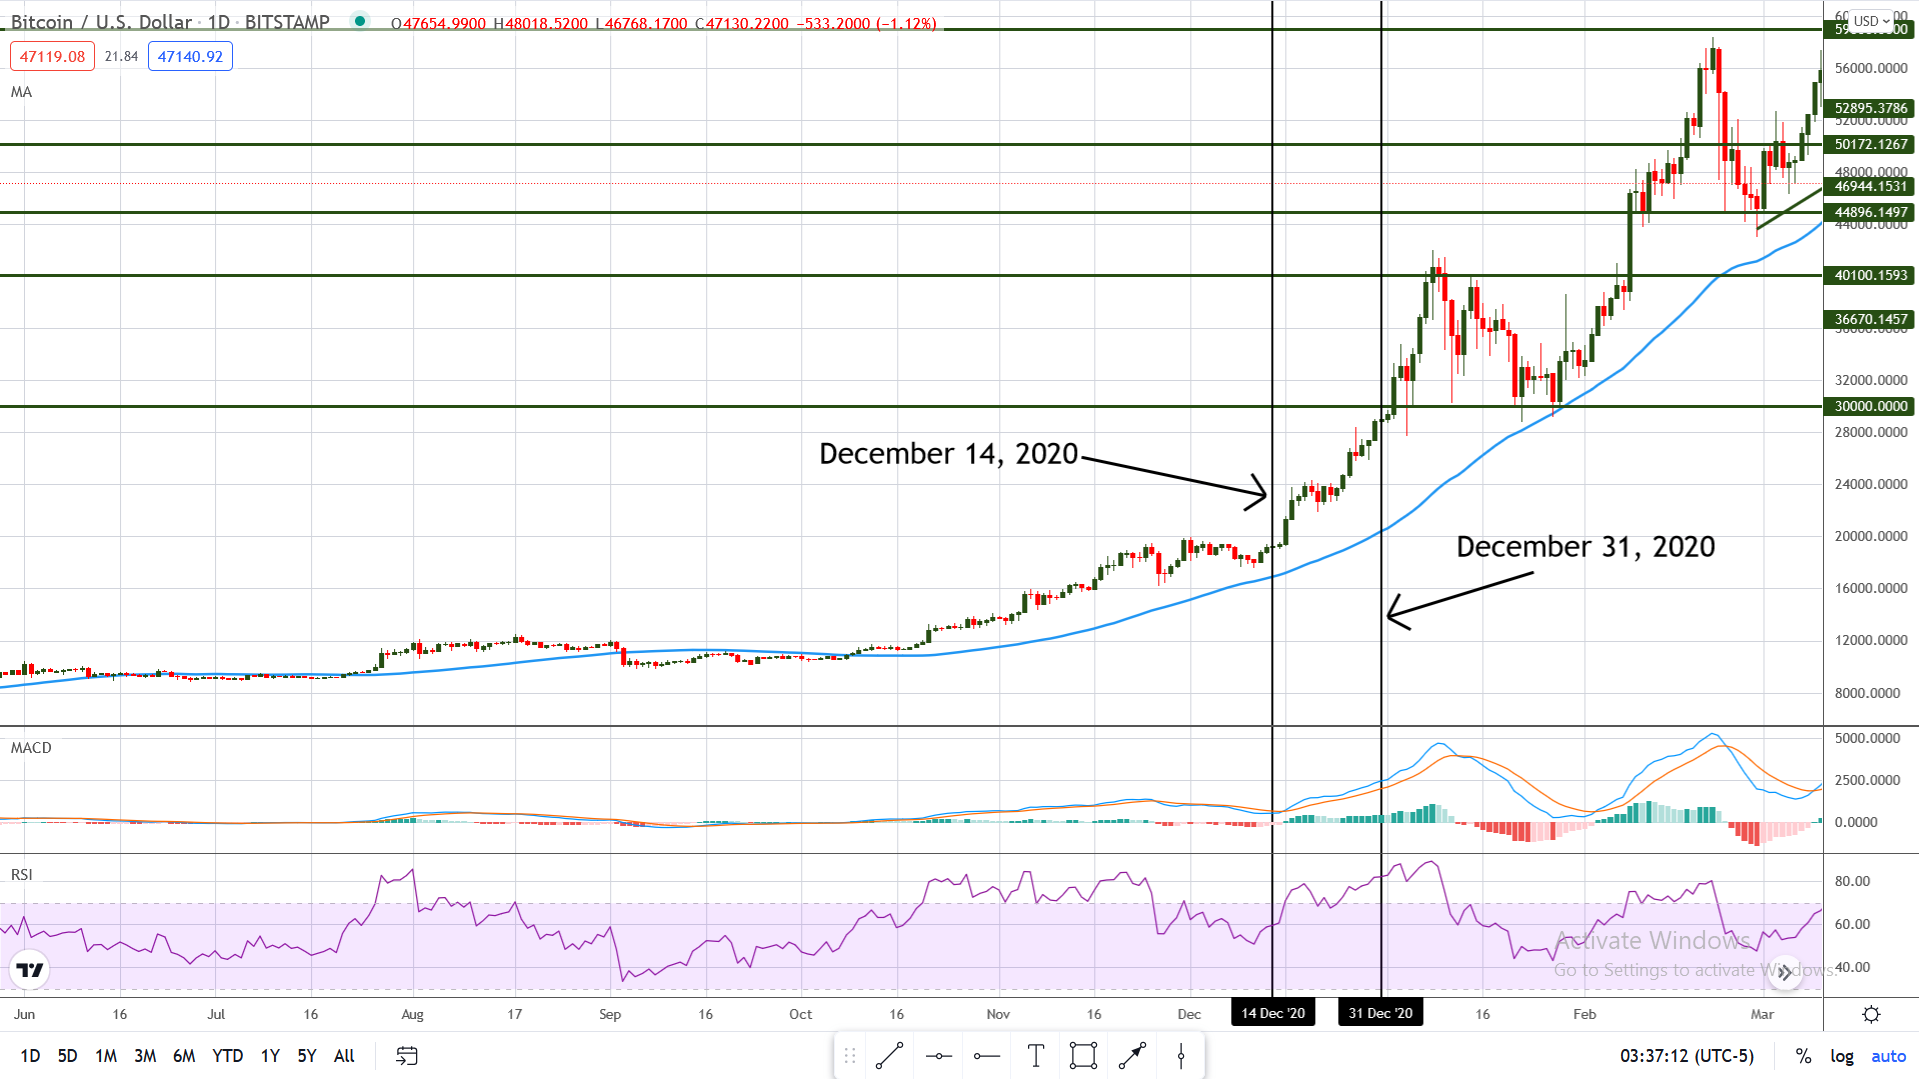
So, can we expect the same type of price action? Well, the chart looked very different during the last 2 weeks of 2020 than it looks now.
Bitcoin was on a serious bull run unlike its current price action, which is bearish. Since November 8, 2021, BTC/USD has been declining rather sharply, which reduces the chances of it adding a 50% gain to the current price. But on the other hand, Bitcoin is known to disregard conventional behavior and can literally spike up out of nowhere.
Just look at the chart above: the entire +50% run was made with Bitcoin being overbought on a Daily chart above: the entire +50% run was made with Bitcoin being overbought on a Daily chart, and more than that, it was seriously overbought prior to that as well. An overbought condition means, under “conventional” rules that the asset is likely to decrease in price. Not the case with Bitcoin during last year’s rally.
Chart Analysis – BTC/USD
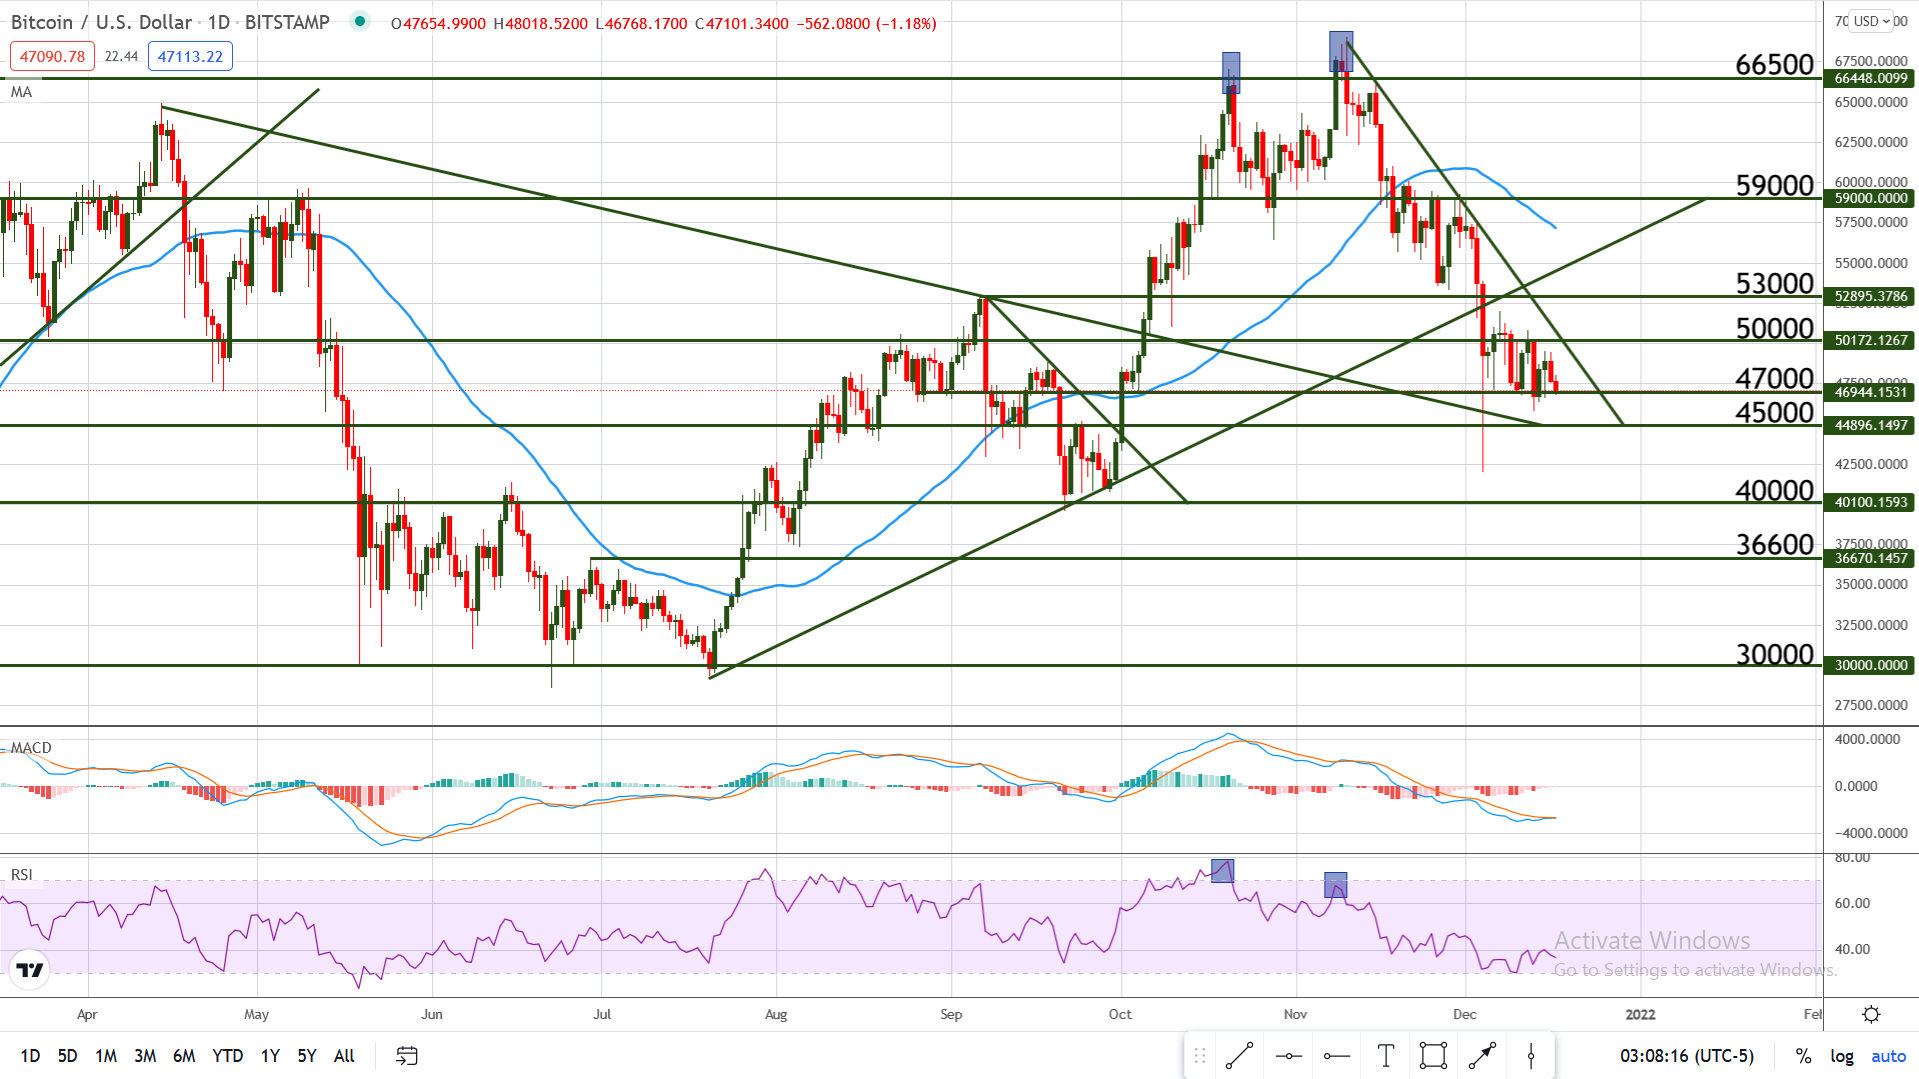
Moving on to the current state of Bitcoin, we can see that it is trading below a bearish trend line and below a bullish one, meaning that it is currently in a short-term downtrend. However, from a longer-term perspective, it is in an uptrend and the current move can be considered a retracement.
Since the bearish spike seen on December 4, Bitcoin has been trading mostly sideways, testing $47,000 support several times without being able to break it. This shows that bearish momentum is starting to fade but it is not indicative of an impending move up because as we can see on the chart below, price also tried to break the $50,000 resistance but failed.
This shows that both sides lack the necessary strength to move price significantly. To break out of this lethargic state, Bitcoin will need some incentive, which can come in many forms, including news, rumors, or even tweets from high-profile personalities.
Talking strictly from a technical perspective, a good place for Bitcoin to reverse its current trajectory is at the confluence zone created by the long-term bearish trend line and $45,000 support. By the time price reaches that zone, the Relative Strength Index will probably become oversold, which will act as a buy trigger for a lot of investors and retail traders. However, a break of this zone will tilt the scales in favor of the bears and will open the door for an extended drop.