El Salvador Adds 80 BTC to Its Holdings as Bitcoin Losses Continue
Bitcoin Whales Start Filling Their Wallets as Bitcoin Plunges Below $20K
“Thank you for selling cheap” – these were the words of El Salvador’s President Bukele as he announced another round of Bitcoin purchases. According to the President’s Twitter account, on June 30, El Salvador bought 80 BTC at $19,000 each.
This puts the country’s total Bitcoin holdings at 2,381 coins, bought at the average price of $43,000. The latest buying spree was worth roughly $1.5 million but the nation is deep in the red if we look at the entire value of its holdings.
When Bitcoin was trading at approximately $38,000, the country’s bottom line on its BTC investment was a negative 20%. At that time, El Salvador’s holdings were worth $68 million (1,801 BTC) and the market decline had caused a loss of $18 million.
According to people who follow El Salvador’s BTC purchases, the loss today stands at $57 million. And these are all public funds! But if the market picks back up, the investment will turn into a profitable one and President Bukele will have the last laugh. Similar to El Salvador’s President, other whales seem to think that now is a good time to buy more Bitcoin.
On June 29, Michael Saylor, co-founder and leader of MicroStrategy, announced on Twitter that the company has purchased 480 BTC, worth roughly $10 million. The company’s stockpile is now approaching 130,000 BTC.
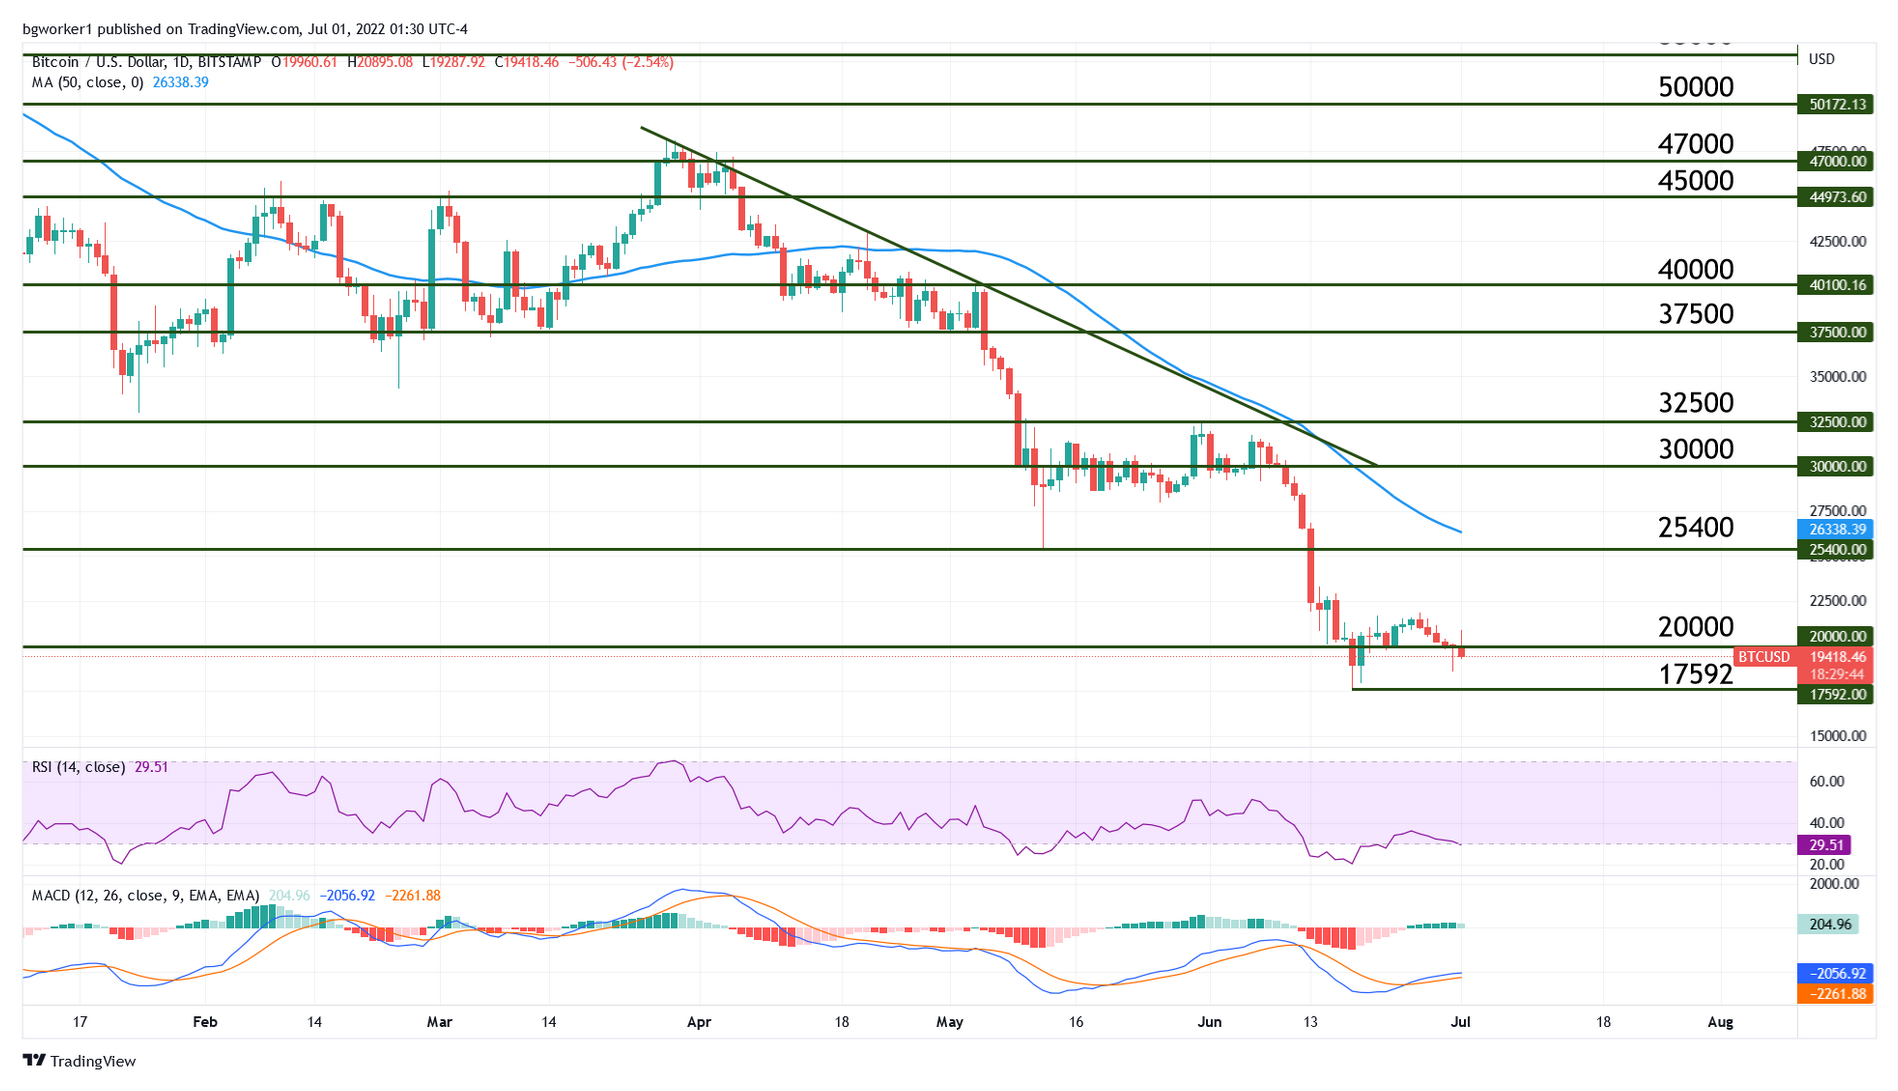
Chart Analysis – BTC/USD
In mid-June, BTC touched $20K for the first time since 2020 and rebounded with good momentum, indicating that we may see additional bullish movement. But despite an initial move above the psychological $20K level, the price ran out of steam and it is currently trading at $19,350.
The failed attempt to establish $20,000 as support shows that Bitcoin could enter an extended bear market. The next major landmarks are $15,000 and $10,000 but the closest is $17,592 (June 18 low).
The Relative Strength Index was oversold when that low was created and it’s worth noting that the last oversold condition appeared back in 2018 (Weekly charts). At the time of writing, the RSI on a Daily chart is just entering oversold for the second time in a short while but there’s no divergence present.
Thursday’s candle is showing bullish rejection but Friday’s candle is showing bearish pressure. However, the current Daily candle is not closed, so the picture could be much different by the end of the day. We might get some more back and forth at the current level but after the bounce-or-break scenario plays out, a clearer direction will probably emerge.