Don’t Use the MACD Indicator Until You Read This
The MACD has a lot of uses, and one of them is divergence…one of the most misunderstood technical signals there is.
It is very common to read articles or analysis discussing divergence as a reversal signal, but tucked somewhere in the text is usually a disclaimer something to the effect of “But divergence can last a long time.” Yeah! So long in fact that it is almost useless as a solo signal!
Before getting into why this is, I will provide my own disclaimer. The MACD can still be useful for divergence when you have another major signal occurring that aligns with the divergence signal. In other words, the MACD divergence only aligns with what you are seeing in price. But do not make the mistake, as so many do, of simply thinking the price will reverse soon because there is divergence on the MACD.
Without delving too much into the math of the MACD let’s look at what divergence is, and what is actually occurring when it happens. This will help us see that it is what price is doing that matters, and not so much the divergence.
Divergence
Divergence is when price is moving one direction and the MACD is moving another. For example, the price and MACD make a high, they both pull back, but as the price makes a new high the MACD makes a lower high than its former high.
It looks like this:
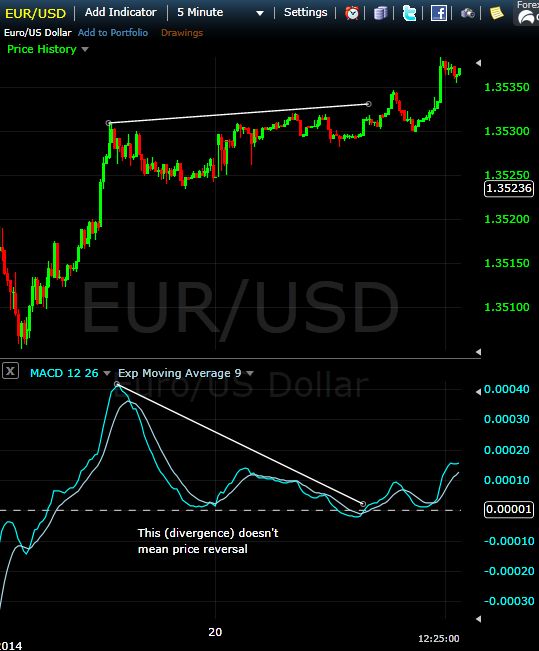
Notice how the EURUSD is still creeping higher overall, making slightly higher highs (marked by the trendline), while the MACD is moving lower and making lower highs.
This is divergence, and many traders and analysts who don’t understand the indicator will say that this sort of divergence means the price is likely to reverse. But instead, toward the right of the chart we actually see the price increase, and the MACD starts to increase again along with it.
Sometimes Divergence can be used to spot reversals, yet it is about as accurate as flipping a coin. Sometimes divergence signals a reversal, and sometimes it doesn’t. Not an ideal way to trade.
What is Actually Happening
There are two lines on the MACD indicator: the first is called the MACD line and it is the difference between a 12-period exponential moving average and a 26-period exponential moving average in price.
The second line, or signal line, is a 9-period moving average of the above.
While exponential moving averages account for all former price action, the most recent price action has the most weight, so the most recent 12 and 26 periods for the MACD line.
All the MACD is essentially doing is plotting moving averages in an indicator, instead of on the price chart.
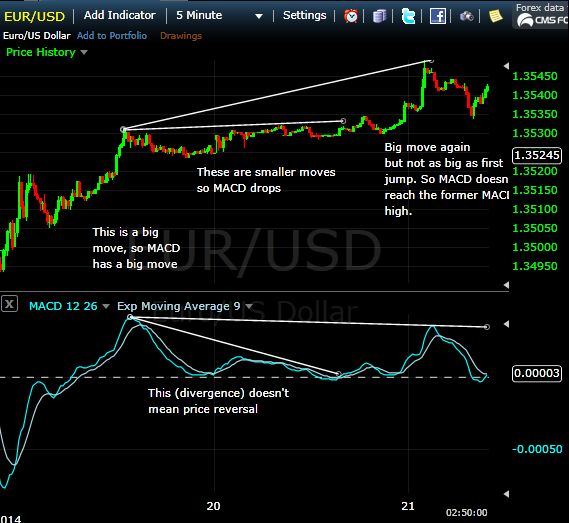
When we consider this, all divergence tells is that the trend is slowing. But even that is misleading. Look at the chart below. On the left we have a big surge higher, causing a big move in the MACD. The price then moves mostly sideways. But the moves are much smaller near the middle of the chart even as the price makes new highs. Unless we see another move like at the left side of the chart, the MACD won’t make new highs. But the trend is not over.
Your focus should be on the price — it continues to move up, and then breaks higher aggressively once again toward the right side of the chart. But even this move isn’t as big as the one of the left of the chart, so the MACD won’t create a new high.
In other words, the MACD doesn’t tell you anything the price action doesn’t tell you. Except the MACD may actually cause more confusion.
You may be asking why the MACD drops when the price action slows down. Refer to the formula above. The MACD is the difference between a 12 and 26 period moving average. During very fast moves these moving averages will separate. When the price begins to the slow, the distance between the moving averages narrows, causing the MACD to decrease.
If you really want to understand how the MACD works, plot a 12 and 26 period exponential moving average on your price chart, and look at how the MACD acts in relation to those averages.
You’ll see there is nothing magical about a divergence, and it definitely shouldn’t be the corner stone of a strategy (although it can be used to confirm other trade signals).
Focus on price, it would have told you to focus on the longs throughout this time period. Then at the right of the chart, you could have used price action to tell you that the trend had shifted and it was time to look for short positions.
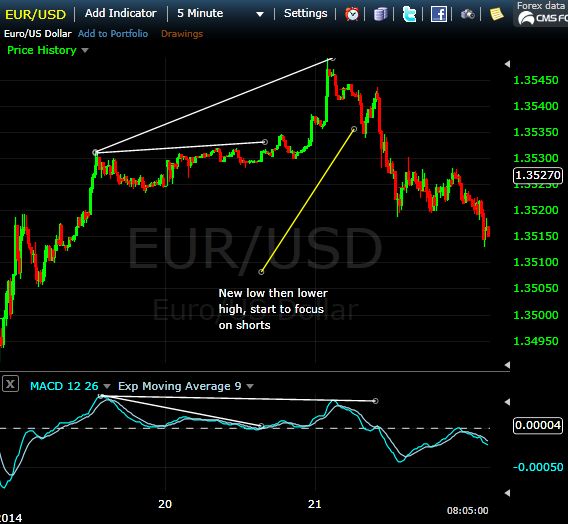
The MACD showed divergence when the price reversed, who cares. Price told you all you needed to know and you wouldn’t have been conflicted over the last two days wondering if you should have taken long positions when the trend was up.
For more on understanding and using price action, see: Interpreting Price Date: Magnitude and Velocity and Should I Through a Pullback or Get Out? Part 1 and Part 2.