Divergences And Binary Options Trading
Divergences are an important tool for binary options trading and one employed by many intermediate and advanced traders. This tool can form in several ways and on several different indicators but the basic theory is the same for all. In fact, divergence theory is so well though of in the trading community that there is an indicator built entirely upon it, the MACD or Moving Average Convergence Divergence Indicator.
So, what is a divergence. According to the Webster’s online dictionary a divergence is defined as a drawing or moving apart and is described by two lines extending out from a common center. According to Investopedia it means when an assets prices and a given indicator move in opposite directions. Taking an oscillator such as the MACD for example we can see on the chart below a classic divergence between the series of peaks in prices and the series in peaks in the indicator.
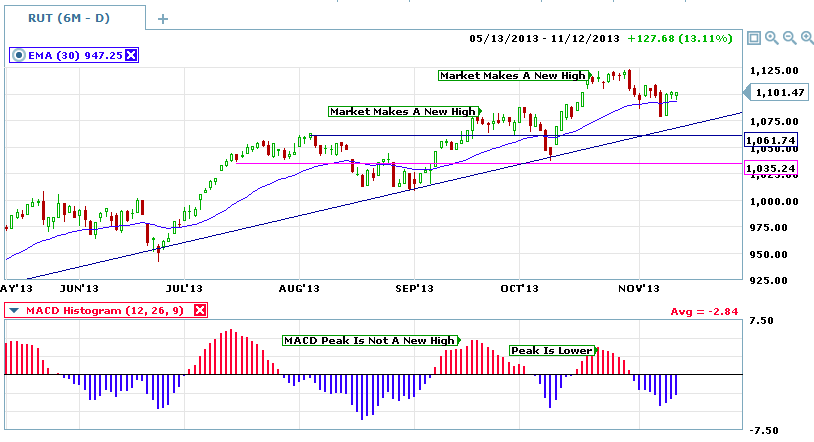
What does a divergence mean and why is it important for trading you ask? Because it is a sign of weakness in a market and an indicator of potential reversal. Looking again at the MACD above. The first peak in the series is strong and makes a new high along with the new high in asset prices. The next high in asset prices is met with another peak in the MACD, only this time it is a smaller peak. The next one is smaller and etc. This means that each time the market makes a new high it is not as strong as the last time. If momentum is declining with each peak it will eventually lead to an exhausted market and potential correction.
Divergences Are A Tool And Not A Signal
One thing you must keep in mind is that a divergence is not a signal by itself. It is a good measure of a market but should only be used along with other indicators to provide signals. When applied correctly to your analysis it can predict market reversals with a high measure of success. What it does not do by itself is provide a clear signal of when that reversal will come. A strongly trending market can wind down for months or even years. It will continue to make new highs or lows all the while the indicators diverge from the trend. Look again at the chart above. Each peak in the MACD coincides with a peak in the price of the asset. Since July there have been two divergences and yet there is no reversal shown on this chart. Do not discount the divergence though, it is still a powerful tool and gains strength when used along side other tools.
Divergences In Time Frames
Time frame analysis is one area where divergences are quite useful for predicting entries. Analyzing divergences between time frames can help to time entries for binary options trading. A time frame divergence may be when prices are moving higher in the longer term yet lower in the shorter term. It may also be when indicators in the longer time frame are pointing up when the same indicators are pointing down in a shorter time frame. For example, if the long term trend is up and the short term trend is down a divergence is occurring that could provide a good entry for a long term position.
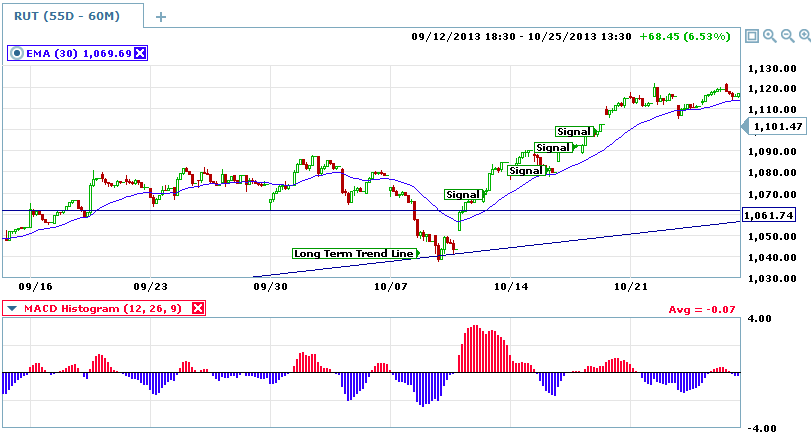
Look again at the chart above. There are an obvious series of peaks and troughs. It would be safe to assume that the most recent trough will result in another peak thereby making this a good time to enter a bullish trade. You could simply enter a trade with a week or a month of expiry to be sure you have enough time or you could move down to a shorter time frame and look for a bullish signal there. The bullish signal in the shorter term would be divergent to the bearish indicators displayed on the longer term. First look at the chart above, in early to mid October there is a bearish peak of MACD. Then look down below at the shorter term chart of hourly prices. The strong bullish MACD peak in mid October indicates the near term trend is reversing and could be the first waves of the next long term rally. This bullish signal would in effect be the initial waves of buying and could result in numerous entry points for savvy traders.
Divergences And Reversals For Binary Options
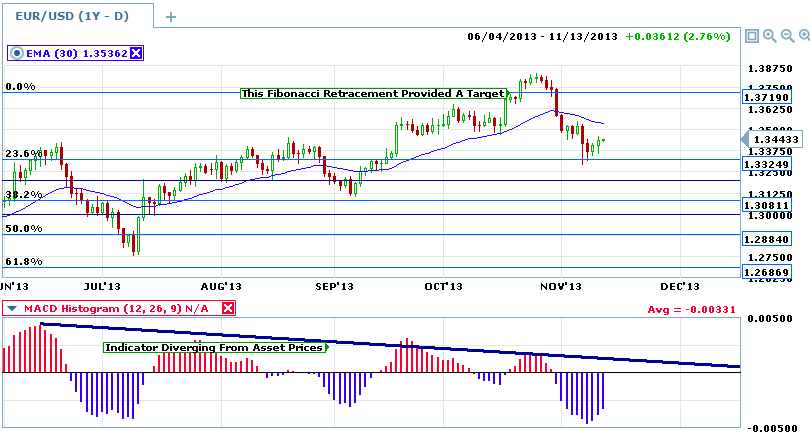
Divergences can and do indicate reversals as well. The nature of divergences does make it hard to pin point reversals but it can be done. In some cases the divergence will wind slowly down until the last peak is nearly zero but this is not always so. Usually there is a target of some kind that can be identified as a potential turning point. When the asset price reaches the target, along with divergent indicators, a reversal is more likely than at other times. Look at the chart below. This is a 6 month chart of the EUR/USD showing Fibonacci Retracements of an earlier move. The 0% retracement level provided a potential target level for a reversal predicted by the divergent MACD indicator. Savvy traders could have entered positions when prices fell back below the retracement level with expiries of one day up to a week and then again once prices broke the moving average.