Crypto Whales Are Moving Massive Amounts of Bitcoin
Is The BTC Rocket Fueling Up For Another Rally?
by Bogdan Giulvezan
According to crypto analytics firm CryptoQuant, a total of $131 billion worth of BTC moved in one day, earlier this month. However, only 1% of the entire amount was moved through exchanges, which may suggest that big players are trading OTC (Over-the-Counter). Meanwhile, the Fund Flow Ratio for all exchanges is at a 2-year low.
CryptoQuant CEO Ki Young Ju stated that this large BTC move combined with the low Fund Flow Ratio could mean that “someone is buying BTC a lot” and continued by saying that “If big names announce their buying, bears could be in a trouble”.
Ki Young Ju also indicated that a similar situation occurred in September 2020. At that time he tweeted “The number of BTC transferred hits the year-high, and those TXs are not from exchanges. Fund Flow Ratio of all exchanges hits the year-low”. As you can see the situations are almost identical and back then, Bitcoin skyrocketed from around $11K to north of 60K. So… can we expect a similar move? I wouldn’t bet the house on it but history often repeats itself.
In other news, Coinbase just added more ways to buy/sell crypto by enabling crypto buys and instant cash-outs using Apple Pay and the corresponding Mastercard or Visa cards. According to a Coinbase Blog post “If you already have a Visa or Mastercard debit card linked in your Apple Wallet, Apple Pay will automatically appear as a payment method when you’re buying crypto with Coinbase on an Apple Pay-supported iOS device or Safari web browser”.
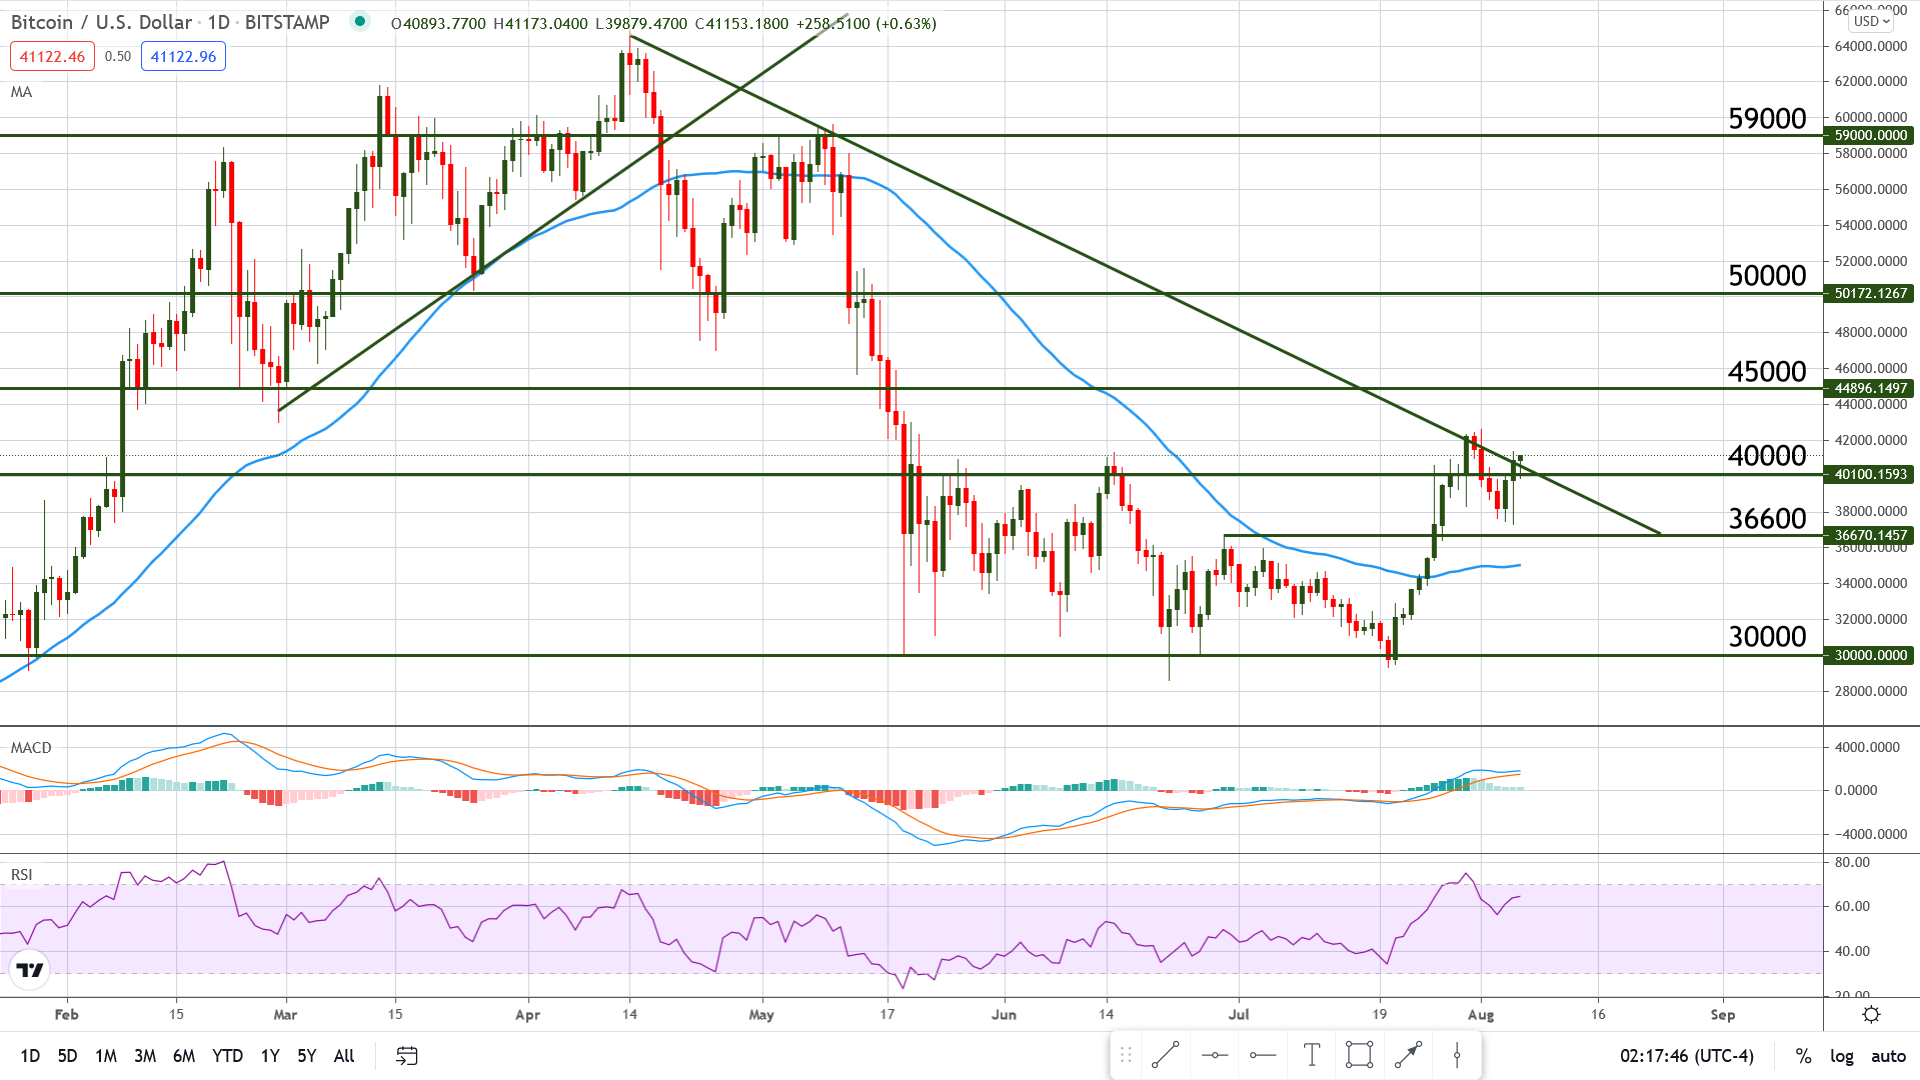
Technical Outlook – BTC/USD
At the time of writing, Bitcoin is trading inches above $41,000 and has added 5.28% in the last 7 days. After the initial climb above the crucial $40,000 level, BTC retreated below the level and in the process, it cleared an overbought condition of the Relative Strength Index.
The pullback was expected because the pair was on a bullish run that extended over the course of 10 days, but the bearish trend line seen on the Daily chart below played an important role as well. Price was rejected twice by this diagonal resistance, which makes the line important for short-term action.
A clear break of the long-term trend line would score a major victory for the bulls, thus opening the door for $45,000. Considering the bullish momentum seen on the chart and the recent positive BTC news, a break is probable but not certain.
The key levels for short-term price action are located around $42,500 (previous high), $40,000 (key S/R), and the zone between $36,600 and $37,500 as support. The bias is bullish as long as the pair is trading above support but the MACD lines are coming together, which indicates that the bullish pressure is subsiding in the short term.