Capitalizing on Lower Highs and Higher Lows in Price
An uptrend can simply be defined as a series of higher-highs in price, coupled with higher-lows. In other words, the overall price direction is higher, even though the price will experience corrections along the way. A downtrend is a series of lower-high and lower-low price swings. These may seem like elementary principles, but in their simplicity is their elegance and usefulness. By understanding these simple concept of trends, it is possible to determine when a trend is healthy and when it is about to reverse. Exploit a higher-low in an uptrend, and a lower-high in a downtrend to capitalize on a changing market direction. Here’s how to do it.
The Set-Up
While I like trading this strategy on all time-frames, I use it mostly for short-term trading since signals are plentiful. Depending on the time frame you are trading, use a 1, 5, 10 or 15 minute chart. For maximum effectiveness utilize the strategy when the market is open and active. For example, if trading the EUR/USD directly or through options, use the strategy only when European markets and/or the US market are open.
After the open, an initial price low or a price high will establish itself. If the price initially makes a low, watch for a higher low to potentially go long/buy calls. If the price initially makes a high, watch for a lower high to potentially go short/buy puts.
Figure 1 shows the EUR/USD on March 13. After the open the price moves higher forming a high, and then drops. We then watch to see if a lower high forms. It does, setting up a potential short/put trade. A couple hours later another lower high forms, setting up another short/put trade. An hour after that, another lower high forms (not marked), setting up another short/put trade.
Figure 1. EUR/USD 15 Minute Chart – Lower High Trades
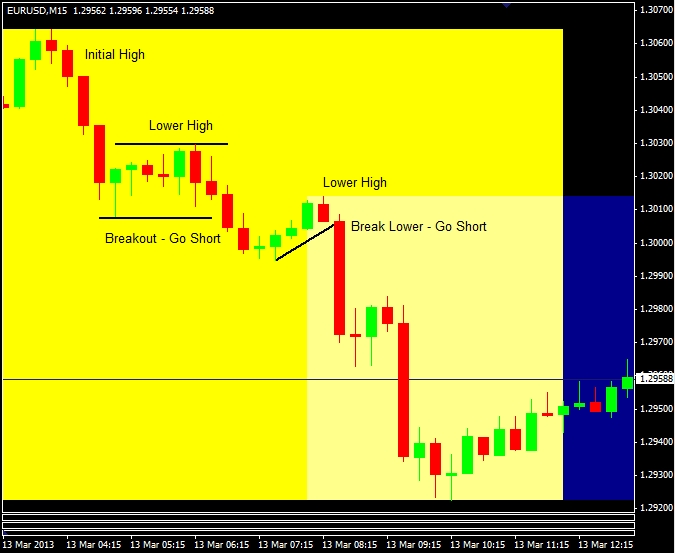 Source: Oanda – MetaTrader
Figure 2 shows gold (XAU/USD) during the US session. The price initially drops forming an initial low, then rallies and forms a higher low. As the price moves up off this higher-low a long/call trade is taken. While not marked on the chart, notice how a high then forms, and then a series of lower lows (like the EUR/USD example above). These lower-lows presented shorting/put opportunities.
Figure 2. Gold (XAU/USD) 15 Minute Chart – Higher Low Trade
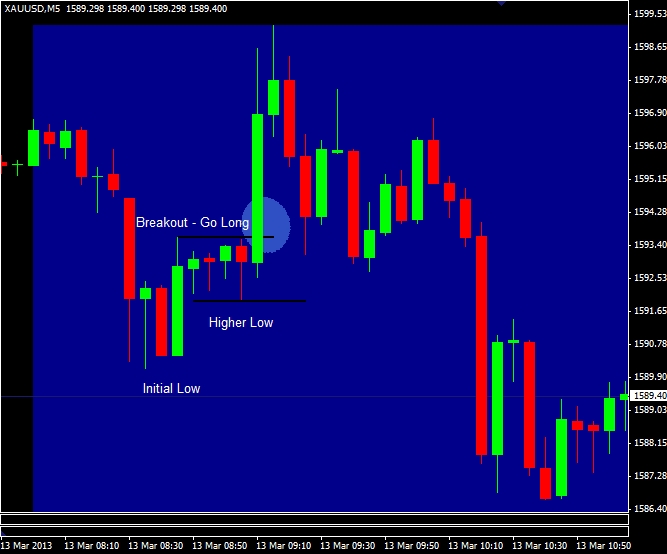
Source: Oanda – MetaTrader
The Trigger
The set-up is fairly simple, and a pattern you will see multiple times each day. But seeing a lower-high or a higher-low isn’t enough to formulate a strategy. You need a trigger–a trade signal that tells when you when it is time to enter the trade.
Once you have a lower-high, you will want to get short, but only when the price begins to drop again. If you have a higher-low, you want to get long, but only when the price begins to rally again. This is where the trigger comes in.
Figure 3 shows the trades from Figure 1, but I have added additional details and named the two typical types of triggers—Range and Channel.
Figure 3. EUR/USD 15 Minute Chart – Trade Triggers
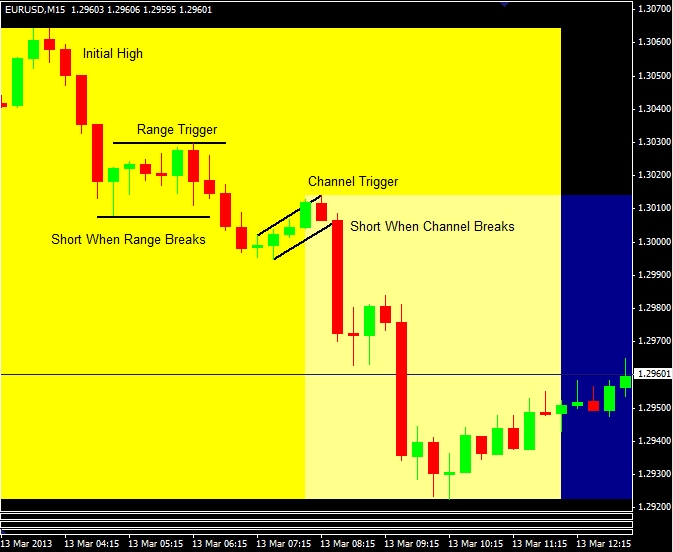
Source: Oanda – MetaTrader
In Figure 3 we see the first lower high develops into a range. Lines are drawn around the range and when the range is broken to the downside a short/put trade is taken. If the range had developed around a higher-low, then wait for a breakout above the high of the range to take a long/call trade.
The second type of typical trigger is a channel break. In this case, the price rallies back toward the prior high, creating a mini-trend, but doesn’t make it to the prior high. As this rally is occurring, draw a trendline below the price bars as they rise. When the price drops below the trendline, go short or take a put trade.
Pros and Cons
With a little practice, seeing the set-up and trading the trigger in real-time will become second nature. The simplicity of the pattern makes it ideal for traders of all levels, and it can be remarkably profitable, especially if combined with personal filters which narrow the number of signals traded. Such filters may include taking only those trades that align with the longer-term trend, or when a technical indicator confirms the trade.
The downside is that during very choppy market conditions, when no real trend develops, you will face losses. Ultimately the strategy relies on a price move to develop after the lower-high or higher-low to compensate us for the risk. If the market is choppy and doesn’t move enough to compensate us, the strategy can produce multiple losses. Therefore, if you notice that the price action is muted or confined within a small range during the session you’re trading, avoid this strategy until the price begins to move more freely.
While the risk and profit are fixed with binary options, if you trade other products you will need to establish risk management and profit taking methods for this strategy. My recent article: Trading the “Mini-Channel Breakout” provides ideas on where to place stops and profit targets on a breakout.
Final Word
This is a basic binary options strategy which can be utilized by itself, or you can make it own by adding filters and building on it. Whether you use the strategy or not, being able to isolate lower-highs and higher-lows as they occur in real-time is a valuable skill to have and greatly helps in gauging market direction. I find the strategy most useful for intra-day trades during active market session. It is highly recommended you utilize a demo account to practice this method before using real money, so you are fully aware of the strategy’s capabilities and drawbacks.