Bullish Signs Buried Deep Within the Crypto Charts
Bitcoin Makes Timid Advances, Yet Full Recovery Is Still Far Away
by Bogdan Giulvezan
After hitting this year’s low at $32,950 on January 24, Bitcoin started a decent but feeble recovery. The apex cryptocurrency is now struggling to stay above $37,500 resistance but the bulls seem weak and without momentum on their side.
Bitcoin’s last few weeks have been very sluggish, with very small candle bodies and long shadows. This indicates that we are in a period of accumulation or distribution but in either case, a strong move will follow. Accumulation is followed by a move higher, while distribution is the precursor of a drop.
On-chain data hints that Bitcoin is in the accumulation phase, as most retail investors and traders are panic selling, while the whales are holding on to their coins and even buying more. On top of this, a bullish impulse may be coming from India as Nirmala Sitharaman, who is India’s Minister of Finance and Corporate Affairs, announced plans to tax cryptocurrency gains at 30%.
This is a positive acknowledgement and nod given by the Indian Government to cryptocurrencies, which shines a light on digital assets by giving them a regulatory framework. The news was somewhat polarizing though, as some pundits complained about the high tax percentage that will be imposed.
Sitharaman also mentioned that the Reserve Bank of India (the country’s central bank) is planning to introduce a CBDC (Central Bank Digital Currency) sometime in 2022 – 2023. This is yet another issue that generates divergent opinions, as some crypto purists consider CBDC’s low-privacy and prone to control.
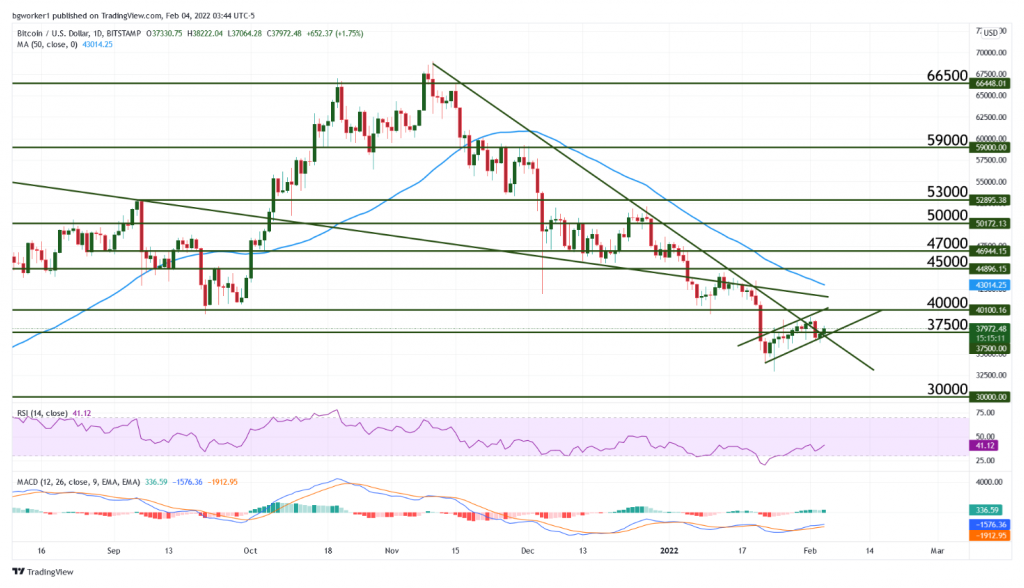
Chart Analysis – BTC/USD
The last 7 days have been bullish for Bitcoin, with a 3.92% increase at the time of writing, according to CoinMarketCap data. This is low for such a volatile coin, but considering that lately the bears have been in control, we can look at it as a decent recovery.
After seemingly breaking $37,500 resistance, the pair returned below it and it is now struggling to move back above. This seesaw movement is likely to turn into more directional price action, but for that to happen, the pair must exit the small rising channel seen on the Daily chart below.
The top border of the channel creates a confluence zone together with the 50 days MA, $40,000 resistance, and a long-term bearish trend line. If the pair manages to break the said confluence zone, it will show clear bullish momentum and this would open the door for further upside. However, the lower part of the channel is currently in peril, as price is very close to it and a break would send it closer to this year’s low.