Bitcoin: The Battle for $50K Is On
Where Does Bitcoin Go From Here?
by Bogdan Giulvezan
After spending more than 2 months trapped inside what seemed like a never-ending range, Bitcoin finally gathered the strength to break out, and earlier this week it reached the key psychological level at $50,000.
Since the high at $50,500, the flagship cryptocurrency has resumed a downward trajectory and is trading at $47,350 at the time of writing, but according to on-chain market data provider Santiment, this Wednesday Bitcoin experienced its largest day of exchange inflows since June 19, 2019.
The data provider tweeted: “Bitcoin (BTC) just made history with its largest day of exchange inflow since June 19, 2019. These days are now tied for the largest inflow day of all-time, both with 1.68M $BTC flowing to exchanges on these respective days. Expect increased volatility.”
According to CryptoQuant CEO Ki-Young Ju, the growing exchange inflows can generate three possible scenarios: “1. Increase selling pressure. 2. Increase volatility as $BTC is used as collateral for derivatives. 3. Alt season with BTC pairs.”
Usually, the fact that investors send BTC to exchanges is a sign that they are preparing to sell but of course, this should be taken with an extra pinch of salt because the only certainty in the crypto market is that there is no certainty.
Technical Outlook – BTC/USD
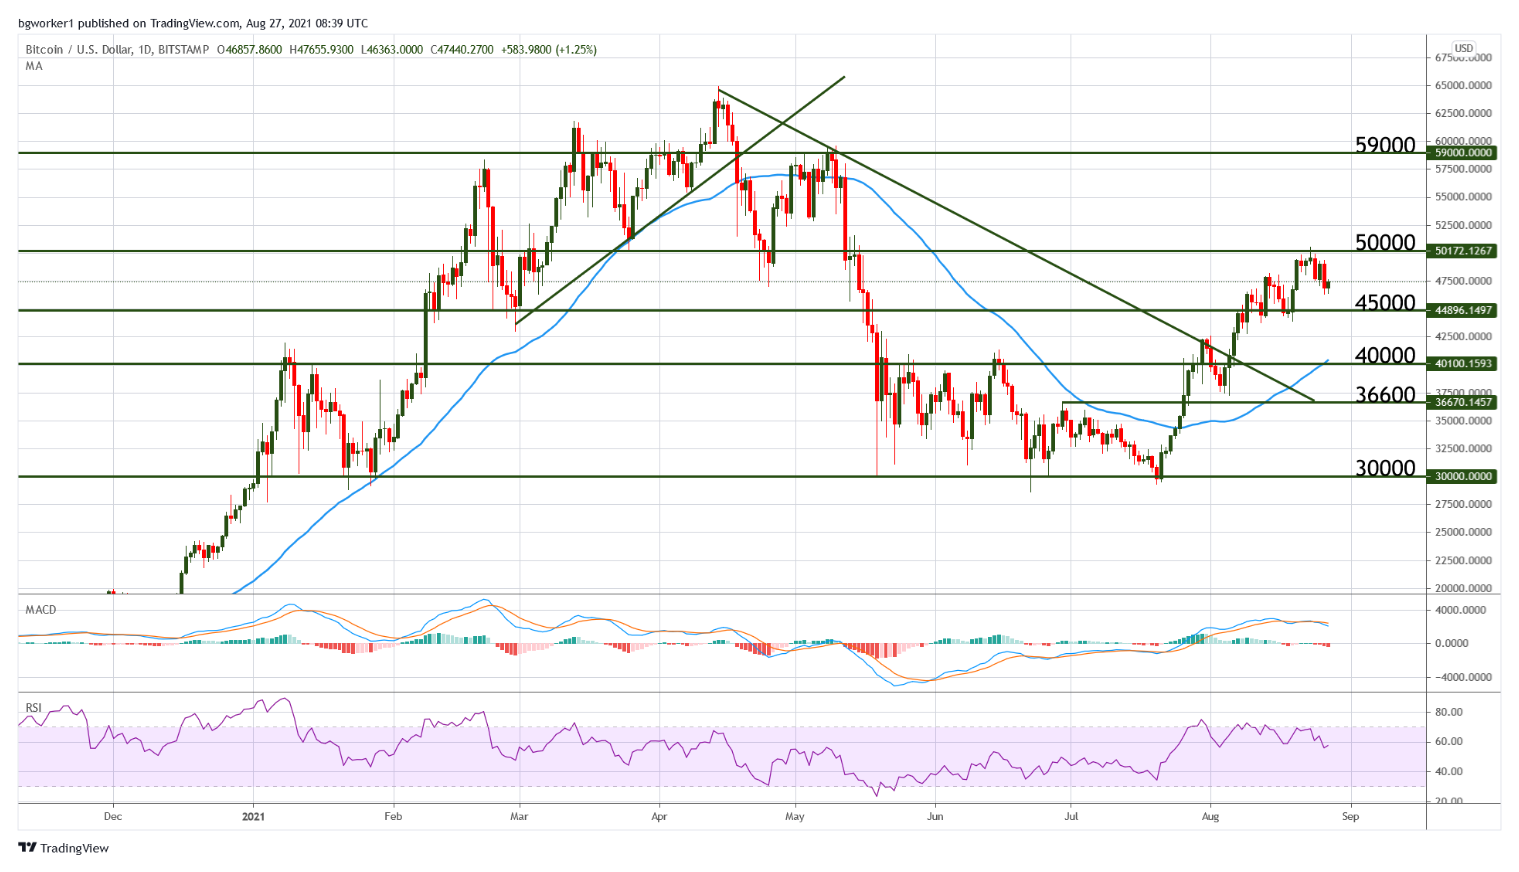
The resistance at $50,000 acted as a laser-accurate barrier and swiftly rejected rising prices as soon as it was touched. Whenever price is approaching a major level, we are dealing with two scenarios – bounce or break – and several factors warned that the former scenario had more chances of happening:
The Relative Strength Index was already showing bearish divergence by making lower highs while price was making higher highs and on top of that, it touched the overbought level several times before BTC reached $50K. And considering that $50K is a psychological barrier (big round number) as well as a technical one, the rejection doesn’t really come as a surprise.
The MACD just revealed a sell signal (bearish crossover of its lines), which combined with the things discussed above, may trigger an extended move south. The first lower target (and a possible barrier) is located at $45,000, which is a confirmed support level because it rejected falling prices just a few days ago.
If the bears take the pair below $45.000, then the 50 days Moving Average will become the next target. Despite the recent weakness, the bias remains bullish from a medium-term perspective, and a break of $50K would put the bulls back in control.