Bitcoin Recaptures $20K. Is Risk Appetite Coming Back?
Deep Oversold Levels and Technical Indicators Point Towards a Bottom.
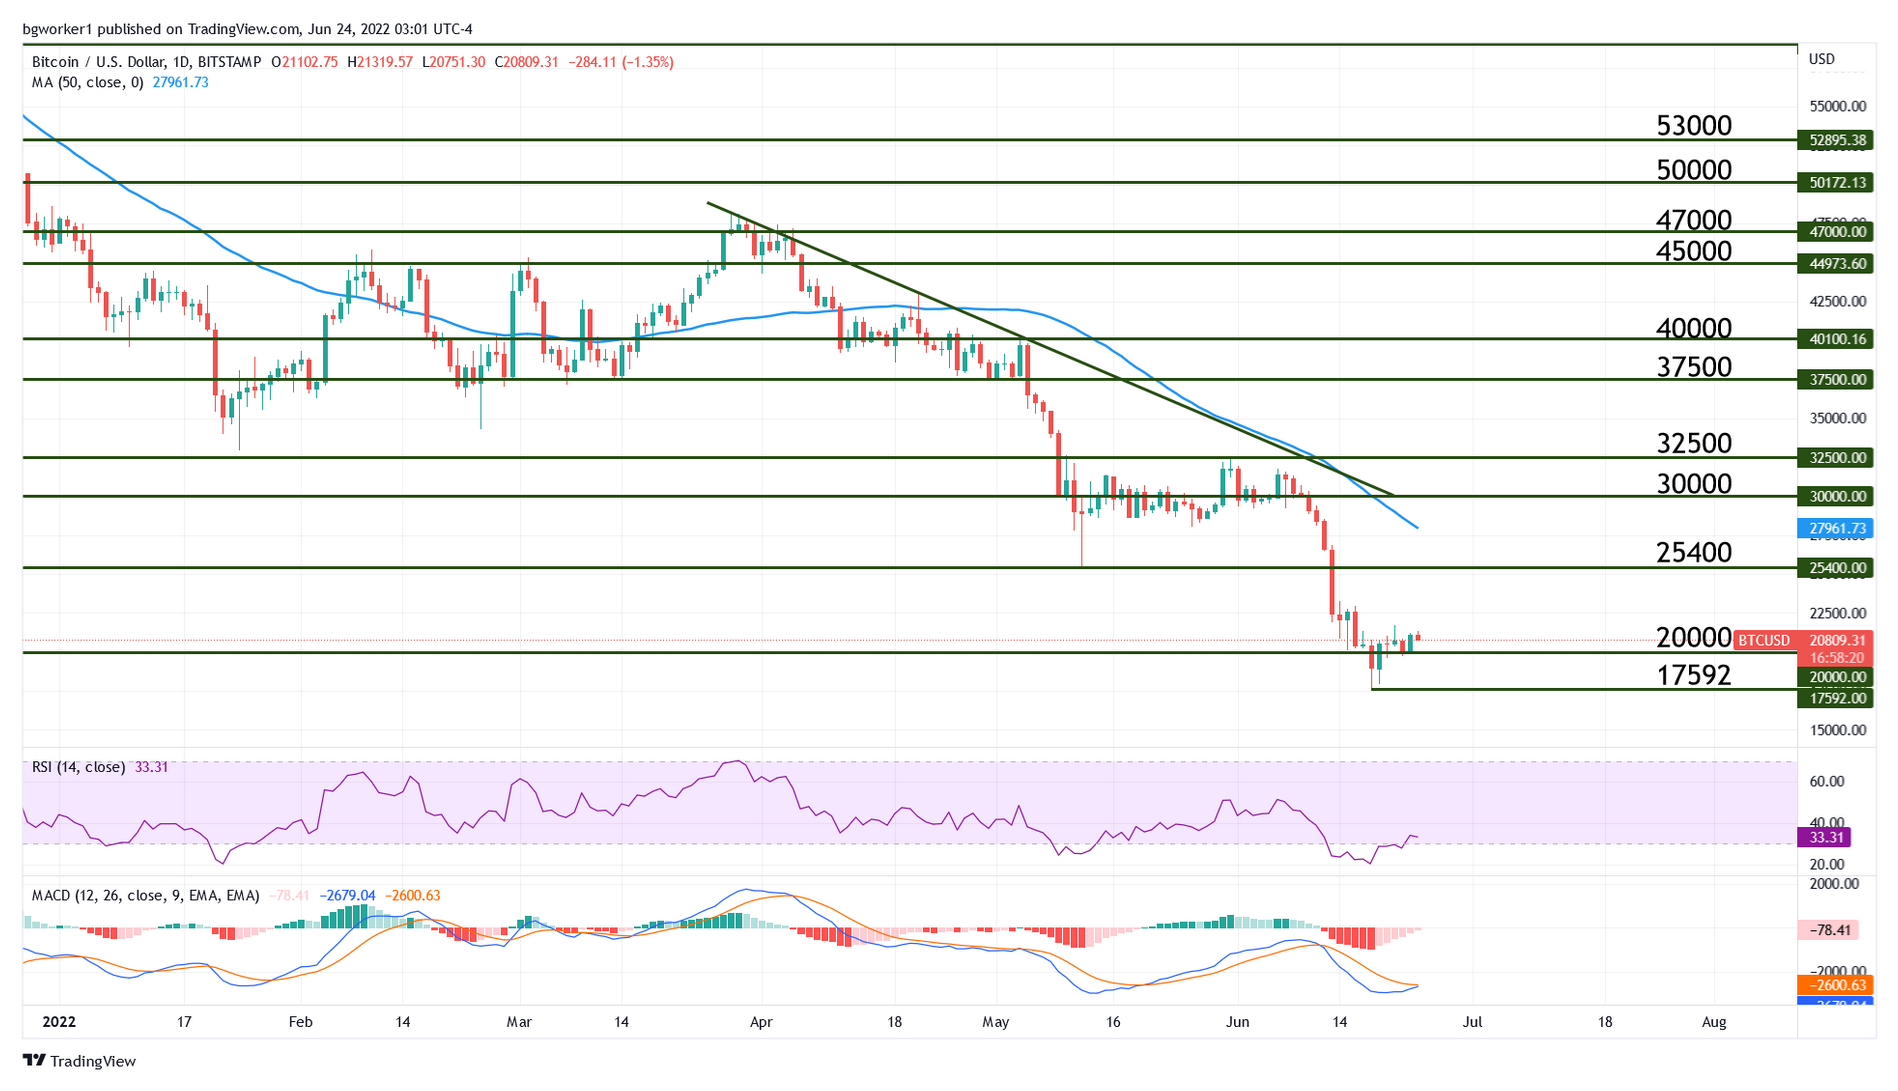
After going as low as $17,592, Bitcoin recaptured the key psychological level at $20,000 and is showing signs of bullish pressure. At the time of writing, the flagship coin is trading at $20,780, with a weekly high at $21,700 and according to technical indicators and price action, a bottom could be in place.
The Relative Strength Index, which is an important indicator for identifying extreme levels such as overbought and oversold, has entered oversold on a Weekly chart. I’ve said many times before that an asset can continue its directional movement despite the RSI showing overbought or oversold but this time it’s a bit different. Why? Because the last time Bitcoin’s RSI entered oversold, the year was 2018.
At that time, the RSI barely touched the 30 level (below 30 an asset is considered oversold and above 70 it is considered overbought) and it immediately bounced higher, pushing from around $3,000 to roughly $13,000 almost in a straight line. Since then, the RSI never touched oversold again, despite long periods of bearish movement. Remember, we are talking about the Weekly chart because on lower timeframe charts, the indicator went below its 30 level several times.
According to Ki-Young Ju, the CEO of on-chain data analytics firm CryptoQuant: “most cycle indicators are saying the bottom”. Data from the same company shows an increase in BTC outflows from crypto exchanges, although the inflows remain high.
When outflows are high, it means that people are taking their crypto assets out of exchanges, probably for safekeeping in their wallets. On the other hand, high inflows suggest that people are moving digital assets into the exchanges, probably aiming to sell in order to shield themselves from lower prices. The current situation (outflows increasing) could be a sign that whales are buying the dip and adding more BTC to their “collection”.
Chart Analysis – BTC/USD
Since the dip to $17,592, the pair closed several Daily candles above $20,000, which is a key level due to its psychological impact but also from a technical standpoint. Right now, this level is considered support ad this opens the door for additional gains.
The Relative Strength Index was oversold on a Daily chart and has now returned above its 30 level. Add to this the Weekly action discussed above and the picture looks pretty good for a stronger rally, possibly into the $23,000 area.
However, we shouldn’t overlook the fact that Bitcoin is in a bear market, thus a drop below $20,000 is not impossible. That being said, the oversold condition of price decreases the probability of a massive drop.