Bitcoin Implodes, Again, Is It Time To Buy, Sell, Or HODL?
Bitcoin Drops below MA Support. Sell, Buy, Wait?
The flagship cryptocurrency has slipped below the 50 days Moving Average for the first time since the 1st of October and is currently trading at $56,300, totaling a 13.0% loss over the last 7 days. Most of the top coins are trading in the red, with Ethereum dropping briefly below the $4,000 mark and losing over 14.0% in the last 7 days, while Binance’s BNB is down almost 13.0%. Even the two meme coins – Dogecoin and Shiba Inu – are down 15.0% and 20.0% respectively.
Part of the dip could be attributed to concerns related to Mt Gox creditors who are likely to become sellers to liquidate their assets. As some of you know, Mt Gox was an exchange that collapsed in 2014 after losing about half a billion US Dollars in Bitcoin, allegedly due to a hack. Just recently, a Tokyo court ratified plans to pay back these creditors and the general opinion is that most of them will start selling once they actually get the money.
In the meantime, cryptocurrency continues to instill fear in the hearts of politicians. During an online appearance at Bloomberg’s New Economy Forum, former Secretary of State, and former Democratic presidential nominee Hillary Clinton, claimed that cryptocurrency could challenge the role of the US Dollar as the world’s reserve currency and furthermore, that it may destabilize nations.
“One more area that I hope nation-states start paying greater attention to is the rise of cryptocurrency — because what looks like a very interesting and exotic effort to literally mine new coins in order to trade with them has the potential for undermining currencies, for undermining the role of the dollars as reserve currencies, for destabilizing nations.” Depending on who you’re asking, her words could be viewed as bullish for crypto in general.
Chart Analysis – BTC/USD
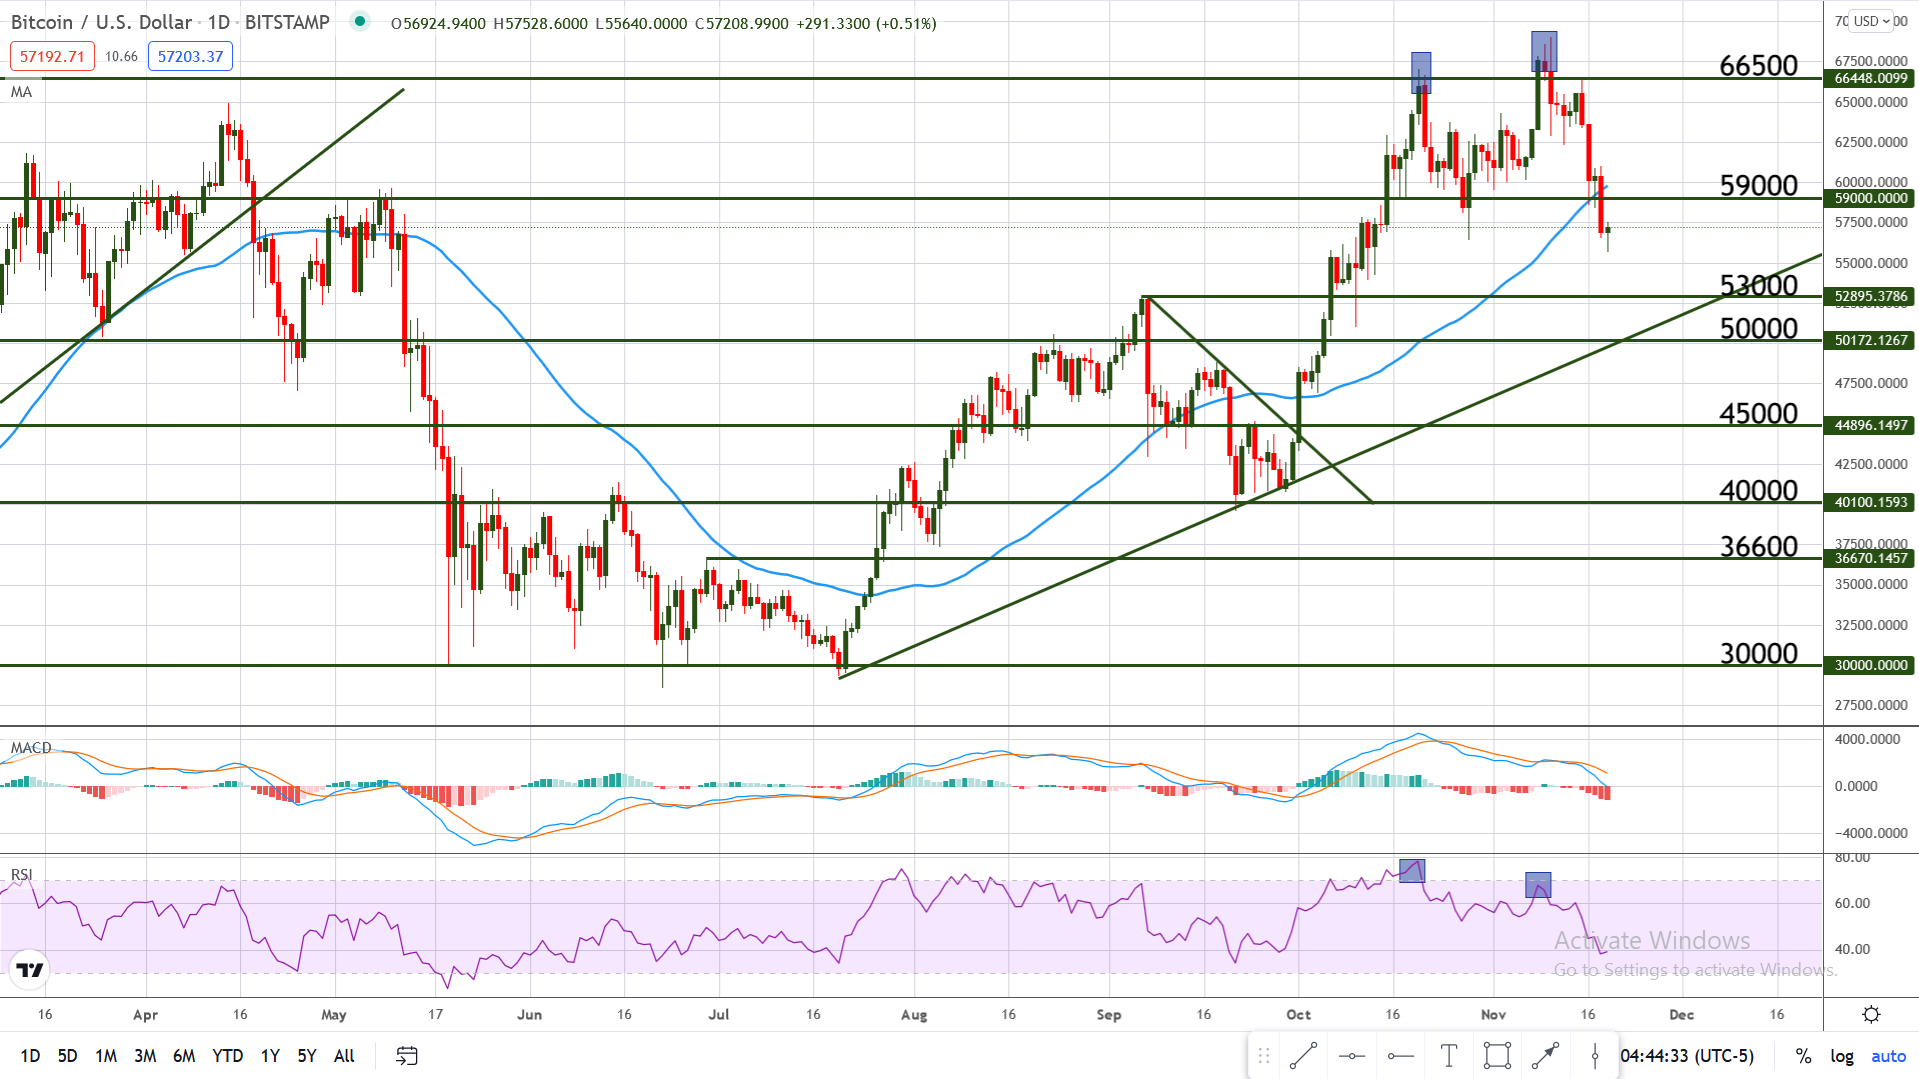
The pair is currently trading at levels last seen in mid-October but the pullback was foretold by a bearish divergence that appeared at the most recent All-Time High.
If we compare the two recent peaks (blue rectangles on the chart below) with their correspondent ones on the RSI, we can see that price made a higher high, while the indicator made a lower high. This is called regular bearish divergence, it appears in an uptrend and is a sign that a retracement will soon occur.
Price has the potential to travel more to the south, especially because the 50 days MA was just broken and this usually determines more traders/investors to sell, but on the other hand, bullish divergence is also present. If we look at the current position of the RSI and its position when price made the previous low, we can notice a divergence between price and the RSI – not a strong divergence but still something to take into consideration.
If we compare the current RSI position with its position when price last touched the long-term uptrend line, we can see a clearer divergence. With this in mind and considering that BTC is in a strong uptrend, it’s likely to see a return above $59,000 and above the 50 MA in the near future. To the south, the next support is located at $53,000.