Bitcoin Grinds Higher Despite Record-High U.S. Inflation
MicroStrategy CEO Still Bullish on Cryptocurrency, Sees BTC as an Inflationary Hedge.
U.S. inflation rose to 9.1% (Year-over-Year), hitting a 40-year high, as evidenced by Wednesday’s Consumer Price Index report. This huge inflationary pressure is helping the US Dollar in its “battle” with other currencies but is posing a palpable threat to the U.S. economy, increasing the risk of a recession.
How did this happen? To cope with the economic stress put on the economy by the Covid-19 pandemic, the government poured huge sums of USD into the economy, which caused inflation to soar. This prompted action from the Fed: in order to contain inflation, the stimulus program was halted and soon after, the rate hikes began. A higher lending rate means there will be less money in circulation, which leads to lower inflation but it poses another risk: economic contraction, which can turn into a recession.
Despite Bitcoin being affected by inflation and other macroeconomic factors, Michael Saylor, CEO of MicroStrategy, continues to be a vocal supporter of the apex cryptocurrency. In a recent tweet, he highlighted the fact that the US Dollar is fluctuating widely against major fiat currencies and said that “It is just a matter of time before the world discovers 1 BTC= 1 BTC”.
This shows Saylor’s belief that Bitcoin is a strong shield against inflation and also his bullishness regarding the flagship cryptocurrency. Currently, MicroStrategy’s BTC stash is 129,699 coins and the paper loss is a whopping $1 billion.
Chart Analysis – BTC/USD
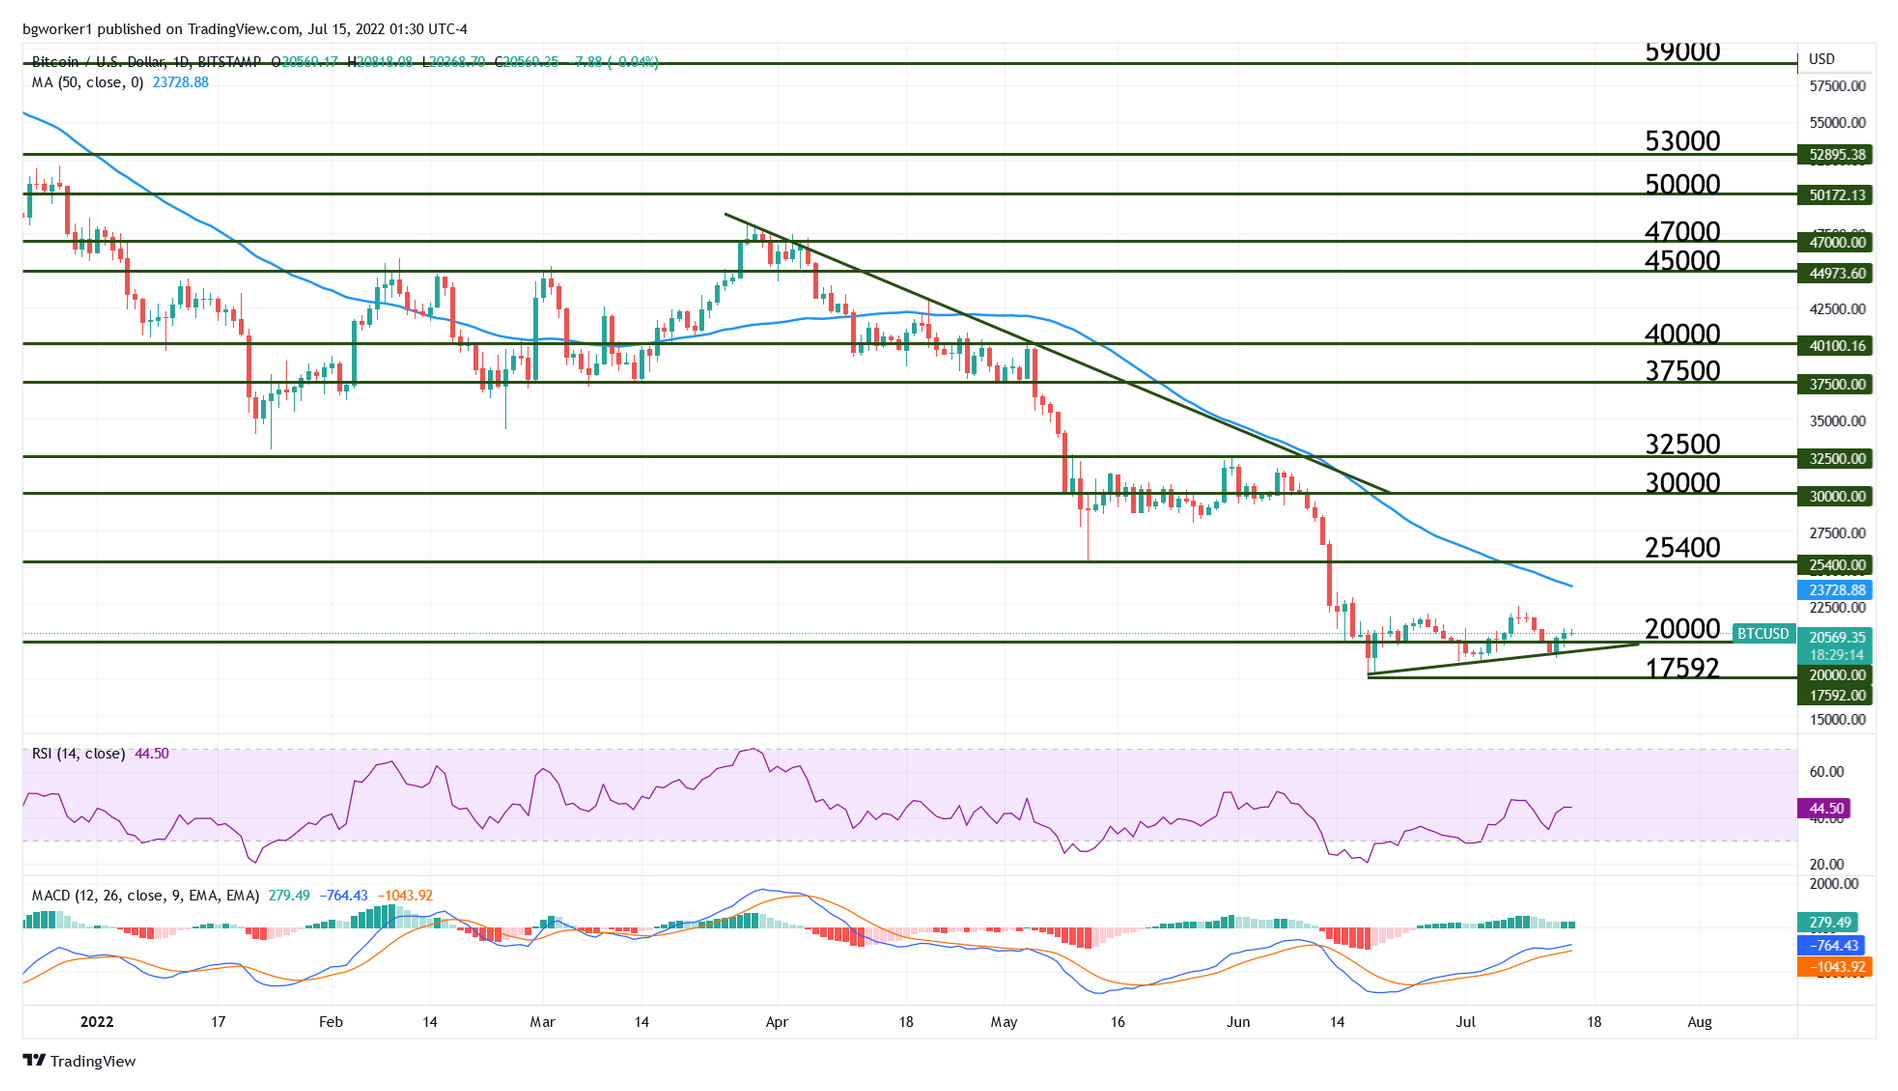
Recently, Bitcoin printed three higher lows: $17,592 on June 18, $18,595 on June 30, and $18,905 on Wednesday (July 13, when the U.S. CPI report came out). The big question is: do we have a bottom? Speaking strictly from a technical point of view – yes, we might have a bottom.
Each of the three recent lows is higher than the preceding one, a bullish trend line has formed, the price returned above the key level at $20K and on a Weekly chart, the Relative Strength Index is oversold. The last time the RSI touched the oversold level was way back in 2018, so we can safely say it’s a very rare occurrence; also, the oversold condition in 2028 was followed by a tremendous uptrend.
But remember: I am speaking strictly from a technical standpoint when I say that the pair may have bottomed out. The fundamental factors such as inflation, correlation with stocks, risk aversion, and others, may have an adverse effect on Bitcoin. In other words, another low could be printed and another leg of the downtrend could begin.
For now, the technical elements to watch are the fresh bullish trend line seen on the chart below, the S/R at $20K, and the July 8 high at $22,400. A break of either one of these elements can trigger additional movement in that direction.