Bitcoin ATH – History in the Making!
Bitcoin $25,000 is Right Around The Corner
By Bogdan Giulvezan
We have a new All Time High! Bitcoin is looking like a rocket once again, speeding through $20,000 and trading at $23,100 at the time of writing. Just to put things in perspective, this March it was trading around $3,000, and many were calling it dead! But if history taught us something is that Bitcoin can “die” many times, only to come back stronger.
Fun fact: the last All Time High was reached on December 17, 2017, and the new ATH was reached on December 17, 2020, exactly three years later. Well, December 18th is not over yet, thus Bitcoin still has time for a new ATH. Regardless if that happens or not, the Crypto Winter is over and the “To The Moon!” party is in full swing. But – yes, the ever-present “but” – remember history: throughout the big 2017 climb, people were mortgaging their houses to buy Bitcoin. That didn’t work out so well! Never forget that what goes up must come down. At this point, we have two scenarios that may play out:
The first scenario is bullish and is triggered by FOMO (Fear Of Missing Out). In this scenario, seeing the recent BTC explosion, more investors and retail clients will start (or continue) to buy Bitcoin because they don’t want to see the rocket go higher without them being aboard. The more people buy BTC, the higher it goes.
The second scenario is bearish and is the result of a cautious approach. The people who bought near the 2017 peak have probably learned their lesson and could possibly sell now, while prices are high. This also applies to people who bought during the 2020 climb – they consider they’ve made enough profit and decide to cash out and get something nice for Christmas. If this happens, Bitcoin’s price will likely go down temporarily.
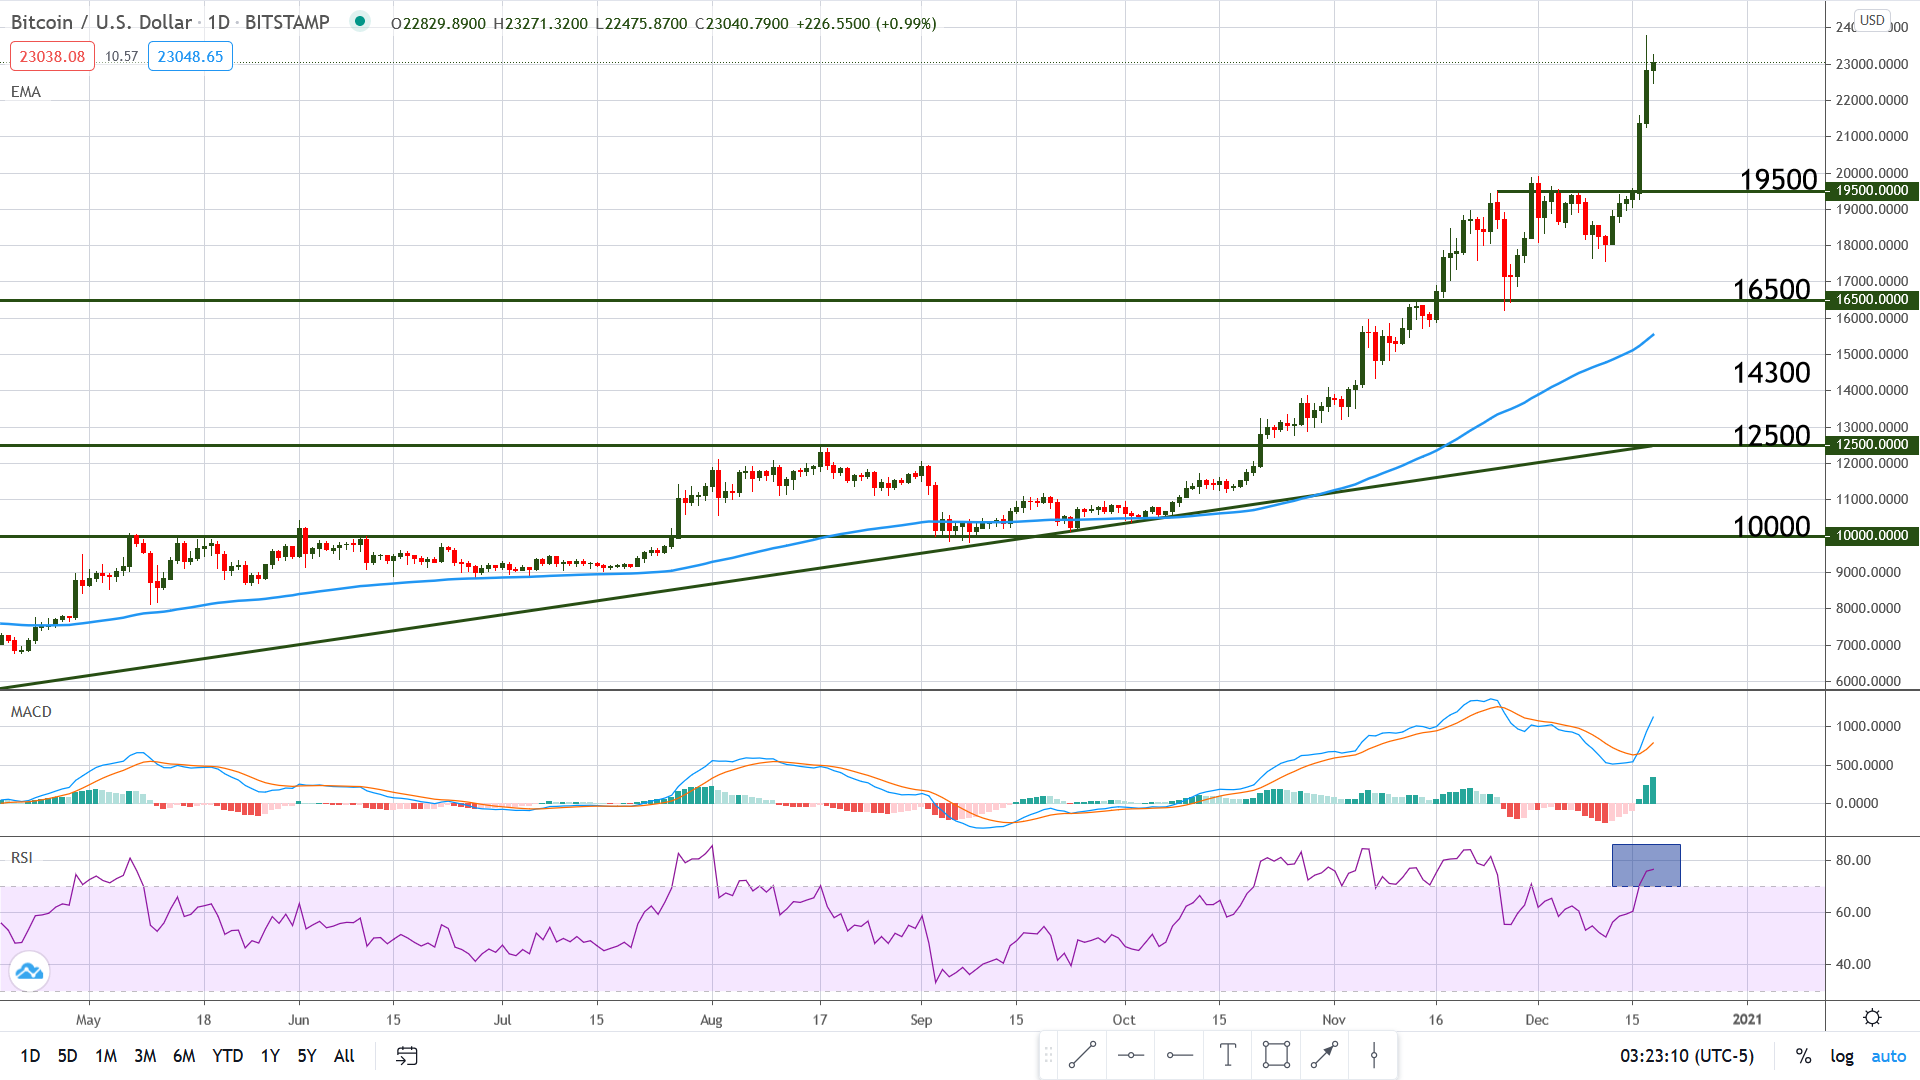
Chart Analysis – BTC/USD
After breaking the resistance zone between $19,500 and $20,000, Bitcoin literally took off and moved straight up, currently trading above $23,000, after reaching an all-time high at $23,539 according to data from CoinMarketCap.
The MACD is moving up, with lines spread apart, which indicates very strong bullish momentum and suggests that BTC may continue to appreciate. The RSI is also moving up, but it has entered overbought territory (above 70), which is an early warning sign that a pullback may soon follow. However, keep in mind that last time when the RSI was overbought, price still climbed for over a month, thus we cannot simply assume that price will come down immediately, just because RSI is overbought.
The Daily candles look very bullish and support the idea of a continued climb, but once we start seeing long wicks, combined with other signals (indicators, news, rumors, etc.), we should know that a retracement is approaching. For now, the levels to watch are $20,000 as major support, $25,000 as major resistance, and all big round numbers in-between as potential S/R.