Bitcoin at a Crossroad: Bounce or Break?
Bullish Chart Pattern Pushes BTC Higher. Strong Resistance Ahead.
by Bogdan Giulvezan
Bitcoin is in the green, up more than 8.0% for the last 7 days and on Thursday it broke the $44,000 level for the first time in three weeks. The rally started after a triple bottom was formed, a pattern I‘ve already talked about in last week’s post, mentioning that it could trigger a sharp rise.
However, the latest bullish move was not entirely generated by technical reasons. The fundamentals played an important part as well: on Thursday the S&P500 and the Nasdaq rallied 1.4% and 1.9&, respectively. Bitcoin and the equity markets are positively correlated, meaning they move similarly, i.e. when S&P500 goes up, BTC goes up.
During the same day, a key Russian lawmaker said they are looking at Bitcoin as an alternative form of payment for Russia’s energy distribution. This could be another reason for Bitcoin’s latest bullish action because the buyers of Russian energy (and we know there are a lot of them) will have to buy Bitcoin to pay for said energy. If more people are buying an asset, it means that its price goes up and even rumors of such a decision can boost Bitcoin.
There’s an old saying in the FX market: “Buy the rumor, sell the news” but at this point, it’s difficult to assess the impact of the mentioned rumor on Bitcoin’s price. However, using Bitcoin to circumvent sanctions is not the best thing that can happen to the crypto world in the long run.
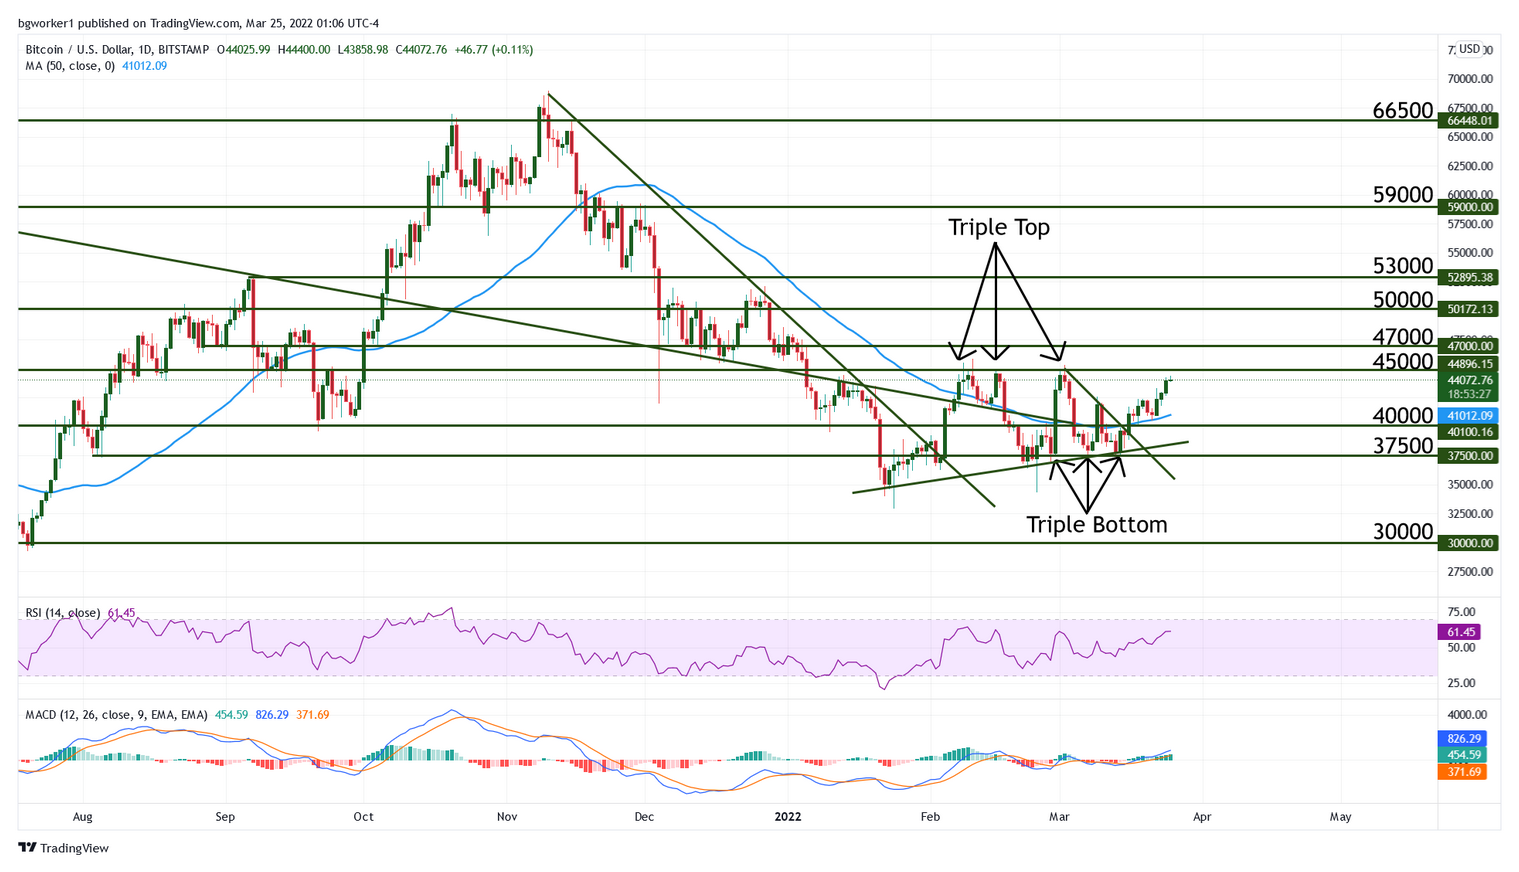
Chart Analysis – BTC/USD
Currently, Bitcoin is trading at $44,200 and is approaching the key resistance at $45,000, which is the upper barrier of the horizontal channel that confined the pair since early February. The probability of a touch of this resistance is high and once that happens, we will be dealing with a bounce-or-break scenario.
If the resistance at $45,000 cannot be broken, that would create a quadruple top, which is a very rare chart pattern, thus the probability is low. If the bulls manage to break the level, it would open the door for a move into $50,000 but the road is not without bumps (there’s resistance at almost all big round numbers in-between).
A factor that supports a breakout scenario is the recent move above the 50-day Moving Average. After the triple bottom was formed, price broke through the confluence zone created by $40,000 resistance, the 50 MA, and the small bearish trend line. All these are indicators that bullish pressure is relatively high, however, we cannot forget about the fundamental factors and the current environment that favors lower-risk assets.