Applying Reflexive Support And Resistance
The Reflexive Theory Of Support And Resistance
Support and resistance are very important factors of techinical analysis. In practice these levels produce areas where signals, reversals, pauses and other technical indications are likely to happen. On a chart a support or resistance line is a line,usually horizontal, that marks an area of previous reversal, congestion or break out. What they are really marking are areas, price levels, where the people in the market, those buying and selling stocks, view the market as either buyable or sellable. As mentioned previously, these levels can be previous bottoms or tops, the tops or bottoms of trading ranges, congestion bands or consolidations, break out’s from recognized chart patterns or break through’s of current support or resistance. Choosing the right places to draw your lines can be tricky, it definitely involves an element of art as there are NUMEROUS places on any chart where S/R could kick in. To learn more about how to draw S/R check out my article on How To Draw The Best Support And Resistance Lines. This article is more about how to use S/R in your analysis and specifically what I call the Reflexive Theory Of Support And Resistance.
The Reflexive Theory Of Support And Resistance
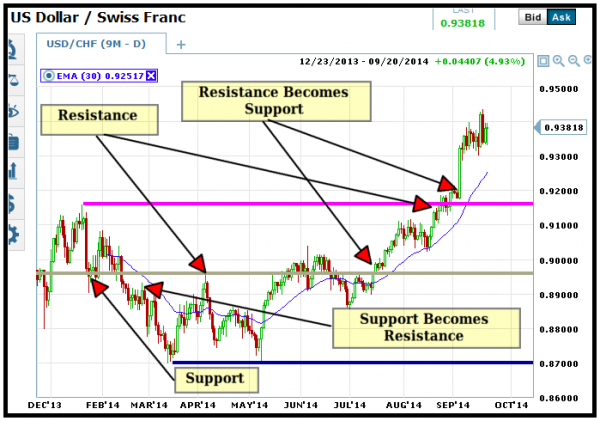
The theory is simple and fairly well know amongst technical analyst although you may not find it under this name. However, when support is broken it can become new resistance; when resistance is broken it can become new support and this is something I learned in the very earliest days of my trading. How is it possible you may ask? First, this is not 100% correct all the time which is why I say “it can become new support”. To understand lets start with what support and resistance really are. I know I have said they are areas on a chart where buying or selling is taking place but what spot on a chart is that not happening? To be more to the point these areas are where significant buying or selling is taking place or has taken place in the past. These levels are usually a price level indicated to be important by multiple types of analysis including but not limited to fundamental, valuation, momentum, sentiment, fear and greed. For one reason or another a significantly large portion of the active market participants in a stock want in or out.
CC ASA 3.0 link back
From a buy side perspective these areas become support. As prices reach the indicated price level buyers step into the market ranging from long term all the way down to the very nearest term day traders and scalpers, depending on the price level. As more and more buyers buy, the market balance swings into their favor, they overpower the sellers and begin to move price up. From the sell side these areas become resistance. As prices reach the indicated level profit taking, short selling or loss recovering takes place, bringing sellers into the market. As more and more sellers sell the market balance shifts into their favor and prices go down. Needless to say there are a lot of emotions involved with this as well. When support holds, euphoria builds in the market and greed helps push it higher. When resistance holds people get cranky as their positions lose money which causes some to escape the market in fear.
How It Works
This is how it works. First, keep in mind the two sides of the story, support and resistance. When prices reach a potential area of support and resistance a battle ensues between the bulls and the bears. Bulls buy, providing support, bears sell, providing resistance. In the case of resistance, if there are enough buyers that they eventually overcome the sellers then it is possible for prices to break through. This is because the market balance shifted into the favor of the bulls. At this time the bears will stop out or cover their positions, adding their weight to the move which can sometimes result in very sharp market movements. Now, this is where the reflexive theory really comes into play. After the break through the market balance is 1) in the favor of the bulls 2) accelerated by the bears getting out and 3) now an attractive place for the market to get in. Bears may change their opinion and become bulls, traders sitting on the sidelines may decide to get into the market and where day traders and momentum seekers may find ample opportunity. The point is, the previous area or price level that provided resistance is now an attractive to place to enter the market because it is where the Bulls overpowered the Bears.